
2018 April - June
5.3 Bixby Developer Studio Release Notes
Updated: June 28, 2018
In this release, in addition to bug fixes, we've introduced a number of updates to the Simulator.
5.3 Simulator Updates
Bootstrap Preference Support
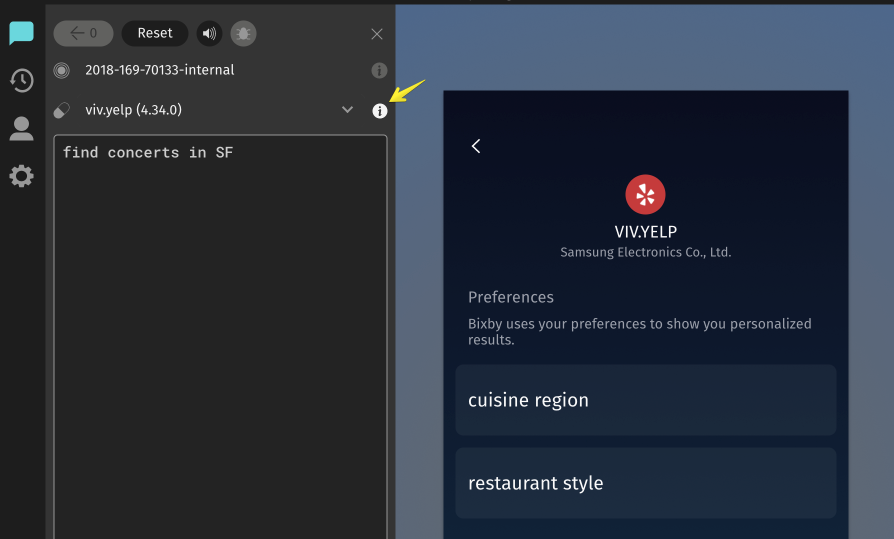
Bixby Developer Studio now allows you to view bootstrap preferences within the Simulator.
If you select the info bubble located on the right of the capsule selector, you now see bootstrap preferences that are shown to the user. You can drill down into specific bootstrap preferences, but you cannot change them.
Button Colors Support
The Simulator now supports showing button foreground (action-fg-color) and background (action-bg-color) colors.
Examples


Provider Icon Support
The Simulator now displays the provider icon if available:
![]()
5.2 Bixby Developer Studio Release Notes
Updated: June 13, 2018
In this release, we've fixed a number of bugs. In particular, we've fixed an issue that caused capsule images (those within the /assets/ folder of your capsule) to show up as broken.
5.1 Bixby Developer Studio Release Notes
Updated: June 4, 2018
Bixby Developer Studio 5.1 is a required update. If you do not update Bixby Developer Studio to this version, you will receive a notification that forces you to download the latest version.
New Drag and Drop Functionality in the Sidebar
You can now drag files into Bixby Developer Studio from your desktop. You can also drag an entire capsule folder into the file navigator. And within Bixby Developer Studio itself, you can now drag files and folders to move them.
5.1 Simulator Updates
Capsule Context Selector
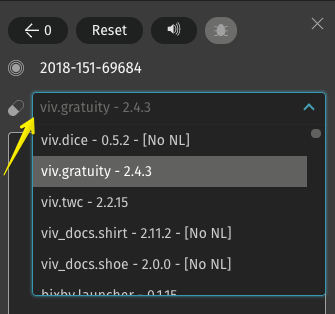
The Simulator now has a Capsule Context Selector that shows all available capsules along with their target version (also known as capsule context). The list includes your workspace-synced capsules and any capsules available with the loaded revision ID. The list also tells you if a capsule does not support NL-based queries ("No NL"). Capsules are ordered by your synced capsules first and then in alphabetical order.
New Location for Revision Selection
We've updated the location of the Revision Selection UI. Whereas it was previously in Settings, you can now find it in the Simulator.
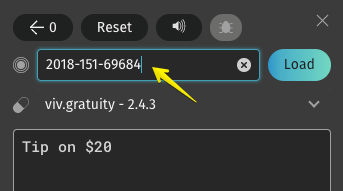
When adding training examples, Bixby currently uses the same revision ID that is selected in the Simulator, though this will change in the near future.
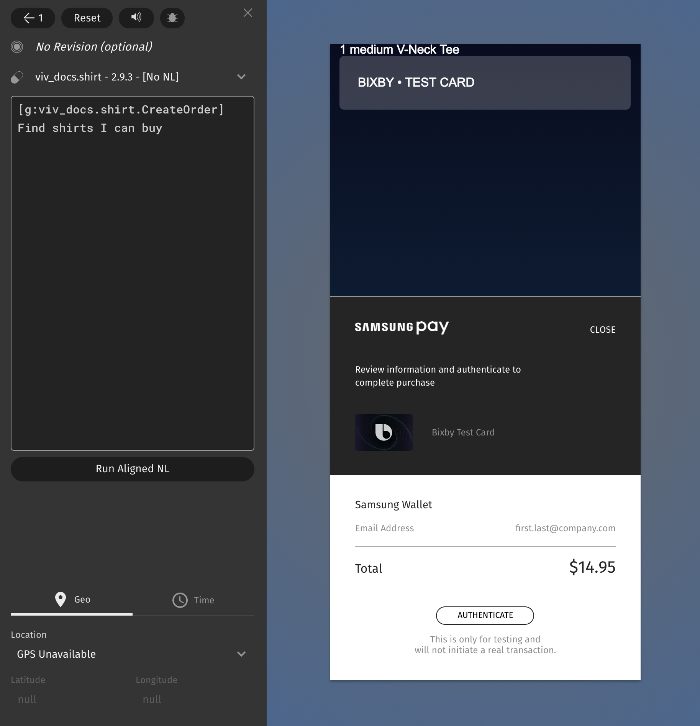
SPS Support in Simulator
You can now test payments using Samsung Payment Service (SPS) within your capsule. When the payment flow starts, the Simulator now renders a mock Samsung Wallet.
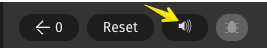
Hands-Free Toggle
If you have designed your capsule to support hands-free devices, the Simulator now has a toggle button for testing capsules in hands-free mode:
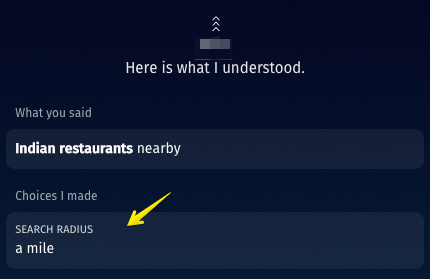
New Understanding Page
To give you a look into Selection Learning, the Simulator now shows the Understanding Page. This page shows you what Bixby understood, as well as the decisions it makes on the user's behalf. You also have the ability to change values on those decisions, as shown in this example with "search radius":
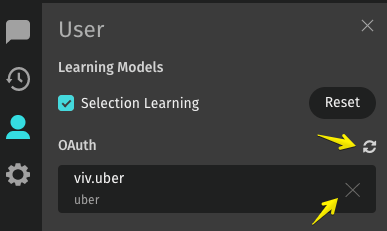
OAuth User Session Management
If your capsule uses OAuth, you can now view and reset OAuth sessions within the User tab of the Simulator:
Auto Refresh of Simulator
The Simulator will now automatically refresh as API updates occur within your capsule. For example, if you have a ride-sharing app, the Simulator now allows you to view a car on a map refresh automatically within your layouts.
Legacy Renderer Retired
We are also retiring the Legacy Renderer (used with Bixby 1.0 capsules). If you are still actively developing Bixby 1.0 capsules, contact us at bixby-support@samsung.com for further assistance.
5.1 Debug Console Updates
To learn more about the Debug Console, read about Debugging.
Improved Concepts and Actions
Within the Debug Console, we've further refined the information you can view when you drill down within Concepts and Actions. Concepts and Actions display the values of the models being used in the query execution, or at the specific selected node along the execution graph. All of the values for models (such as results, functions, dialog) can be displayed entirely within the Inspector by expanding their levels in the data structure tree.
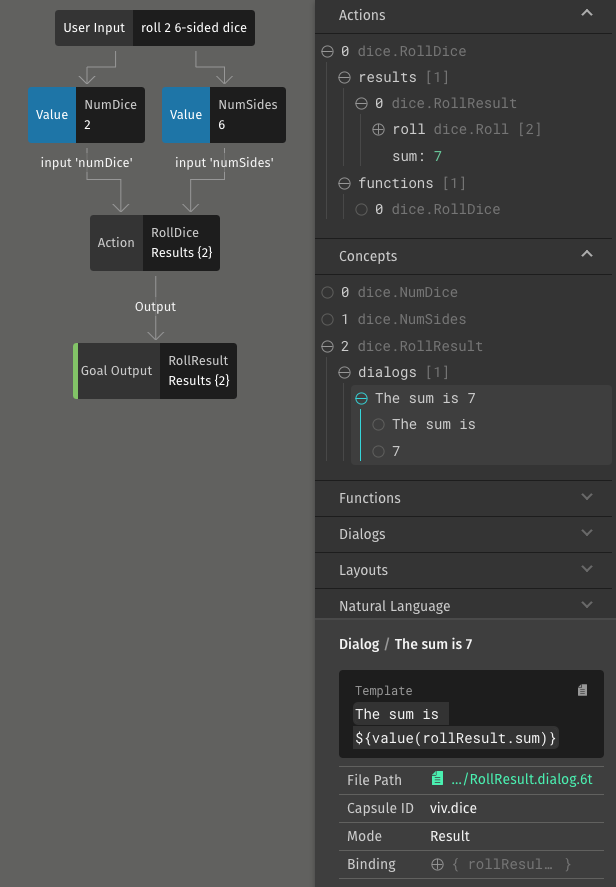
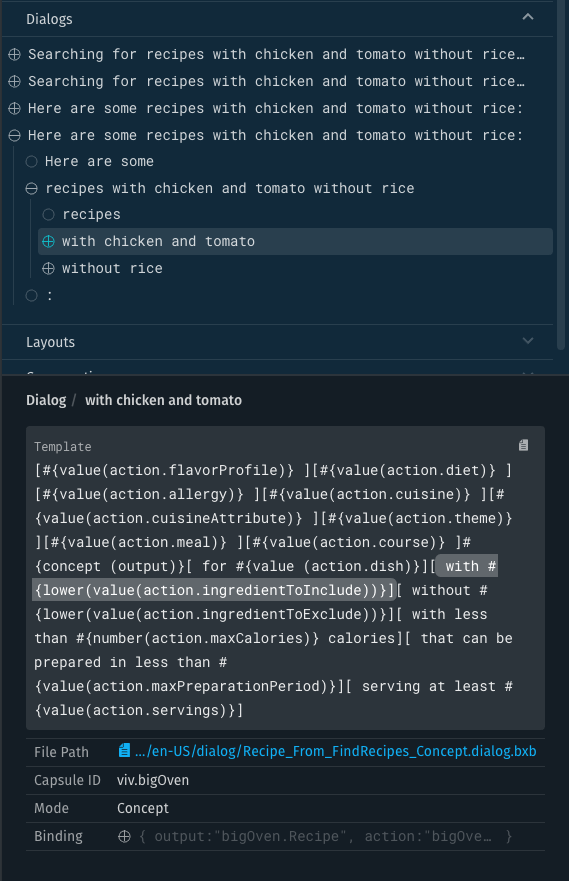
Dialog Refinement within Debug Console
We've improved the Dialogs section of the Debug Console so you can now drill down within dialog and inspect individual phrases. You can then view corresponding templates, file paths, concepts, and other metadata.
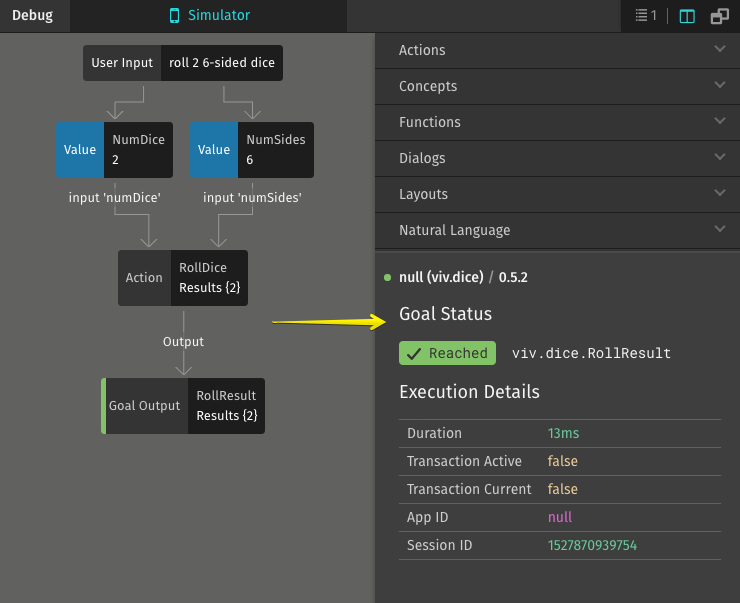
New Summary View
We've also added a new Summary view to the Debug Console that allows you to quickly view information about execution, such as whether or not the goal was reached as well as errors, warnings, or prompts that occur.
Test Console Replaced with Debug Console
With the continuous improvements we've made to the Debug Console, we are now retiring the old Test Console.
Broken Capsule Images Known Issue
In the 18J Bixby Developer Studio, there is currently an issue that causes capsule images (those within the /assets/ folder of your capsule) to show up as broken. This does not apply to images hosted outside of the capsule on third-party services. This issue will be fixed in our next release.
4.23 Bixby Developer Studio Release Notes
Updated: April 20, 2018
In this release, we didn't release any major features, but we did fix a number of bugs! 🐞
4.22 Bixby Developer Studio Release Notes
Updated: April 3, 2018
In this release, we've fixed a number of bugs and made updates to the Debug Console. Please continue to test the Simulator and Debug Console. If you see issues, do let us know by posting on the dedicated Quandora website. We appreciate your feedback and will continue to address issues as they come in.
4.22 Debug Console Updates
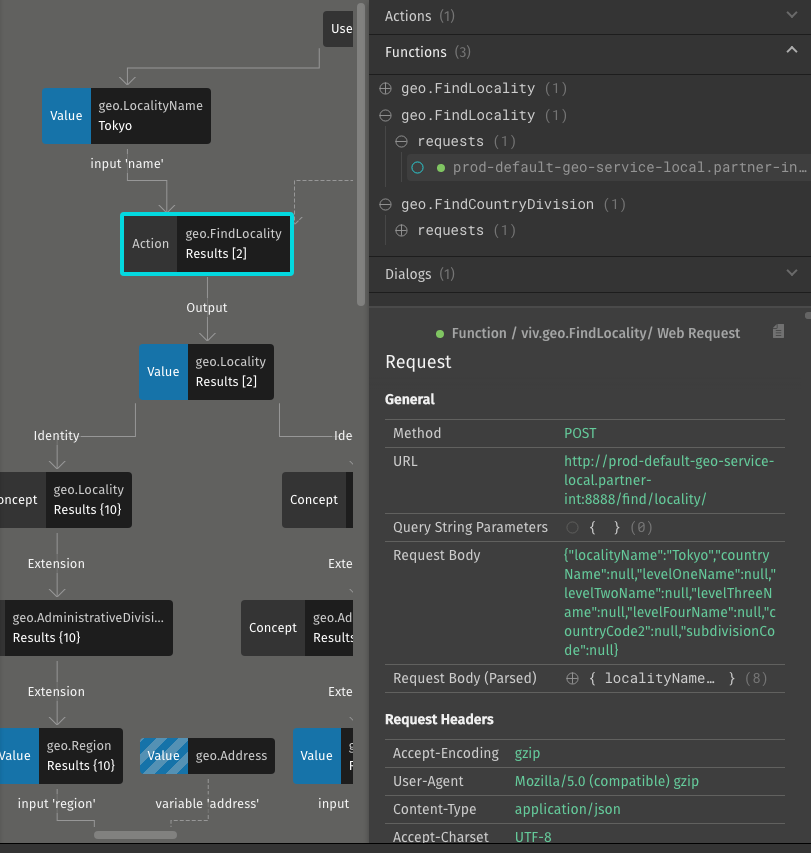
As the new Debug Console continues to be refined, we've introduced a new pane for Functions and NL.
The Functions pane allows you to view details related to functions within your capsule including:
- function logs
- action results
- web requests and responses
- request and response headers
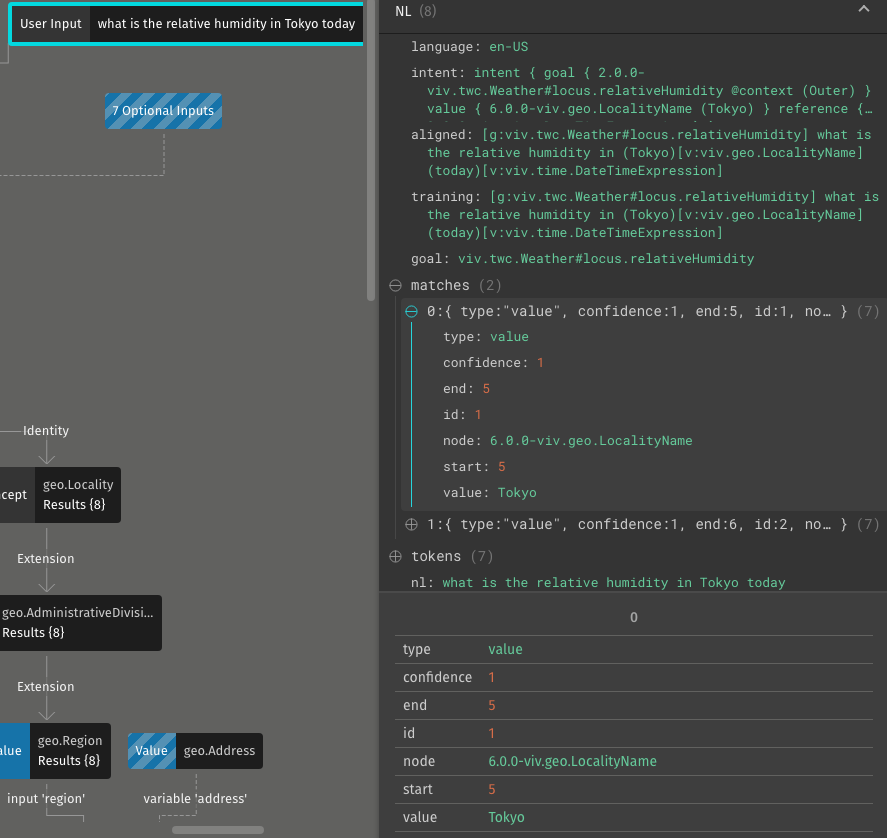
The Natural Language (NL) pane provides a host of data related to the NL interpretation including:
- Language
- Aligned NL
- Training data
- Matches
- NL tokens
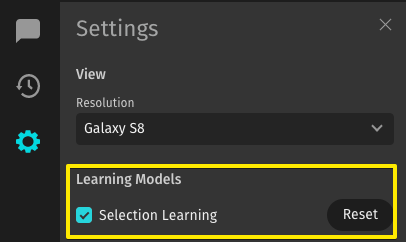
Selection Learning Settings
We've added a toggle for Selection Learning in the settings for the Simulator. You can also click the Reset button to reset Selection Learning, which can help when testing strategies and you want to clear existing learning:
We'll be adding more debug features within Bixby Developer Studio for Selection Learning in the coming months.
Keep in mind that the Reset button is currently tied to your specific developer account and only resets Selection Learning related to your persona.