
Debugging
The Debug Console is a tool in Bixby Developer Studio (Bixby Studio) that allows you to view all of the important aspects of how a query runs within your capsule. You can see the query's execution graph and inspect every step's input and output, including associated Actions, Concepts, Functions, Dialogs, Layouts, and Natural Language (NL) information. If you've used the developer tools in Chrome, Firefox, or Safari for inspecting scripts and page elements, Bixby's Debug Console will be familiar.
Many of these examples are drawn from the Dice sample capsule in the Quick Start Guide.
The Debug Console
To open the Debug Console, do one of the following:
- Select View > Open Debug Console in Bixby Studio. (This is Shift+Cmd+D on macOS and Shift+Ctrl+D on Windows.)
- Click the Debug Console icon in the Activity Bar.
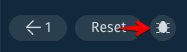
- Click the Debug Console button in the Simulator.
- Select and run a story in Bixby Studio, and click the Debug Console button.
Like the editor pane, the Debug Console can have multiple views in tabs listed along the top of its window—for example, Simulator output in one tab (which will be titled "Simulator") and output from stories in other tabs. As with Bixby Studio, a drop-down list of tabs is also available.
You can only use the Debug Console after the query you wish to debug has been executed. If the Console is not displaying information, open the Simulator and execute a NL or Aligned NL query, or run the story you are trying to debug.
The Execution Graph
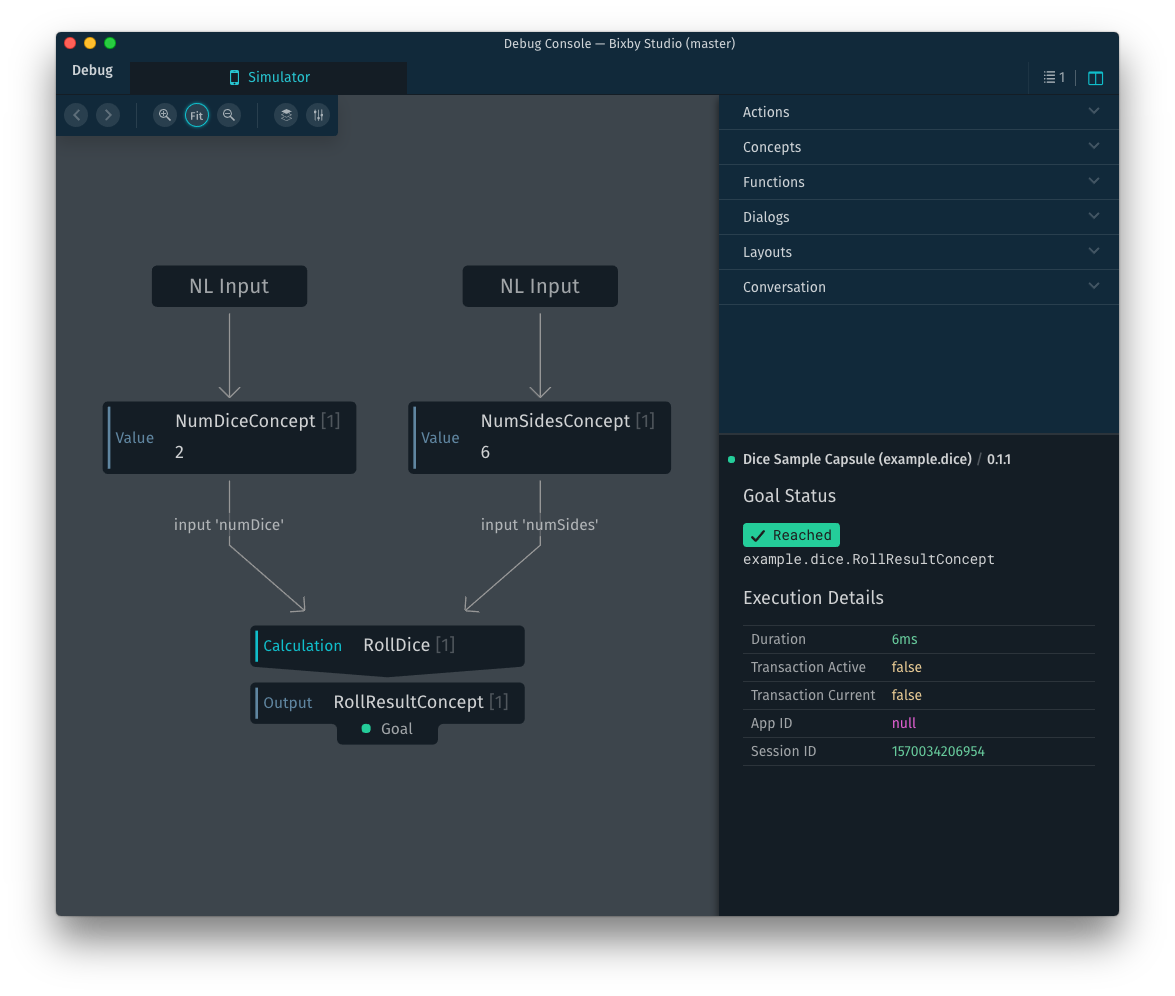
The left side of the Debug Console window displays the query's execution graph, starting at the user input at the top and arriving at the final goal output at the bottom. By following the graph, you can see the program that Bixby wrote and executed in order to respond to the query.
Clicking on any node of the graph will change the visible sections in the Inspector pane (the right side of the window), showing only the information used in that execution step. Click outside of a graph node in the execution graph pane to display all the available sections in the Inspector.
The Graph Toolbar, the strip of buttons at the top left of the execution graph window, controls display settings and lets you navigate through selection history.
- The arrow buttons (< and >) move backward and forward through selection history in both the execution graph and the X-Ray Pane. Click backward to select (and deselect) nodes and panes that were previously in those states; click forward to move through more recent selection states.
- The magnifying glass icons zoom in (+) and out (–) on the graph.
- The Fit button resizes the entire graph to fit in the current window.
- The Plan Versions button lets you step through states in the execution graph, from initialization to finish. (See Plan Versions below.)
- The Plan View button brings up display options for the execution graph. Currently, there is one option, "Show Import Executions." When enabled, the graph will show nodes from imported capsules; when disabled, they are represented as a single node with the capsule name.
Understanding the Graph
Value nodes in the execution graph are annotated by color, shape, and text:
- Blue nodes indicate actions, with a "down arrow" shape pointing to their output.
- Gray nodes are values or concepts. A striped background indicates the value is optional. If a value node appears directly under an action node, it indicates that it is the action's concept.
- Red nodes indicate missing values. Values can be missing because execution has not completed yet. (If this is the case, the Goal Status in the Inspector will indicate that output is pending.)
- Purple nodes indicate roles.
- Hexagonal nodes indicate imported capsules. Normally, execution steps within an imported capsule are hidden in the graph, but you can show them by clicking "Show Import Executions" in the graph display options.
Goal nodes can also be annotated by color and shape:
- Notches on the top of a goal node indicate the goal is set to an action.
- Notches on the bottom of a goal node indicate the goal is set to an output (a concept).
- Green dots indicate successful execution.
- Red dots indicate a failure.
If an error has occurred during the program's execution, the X-Ray Pane will display the failure message when either no node or a node with a red failure dot is selected. See "Issue Inspection" below.
Plan Versions
The Plan Versions display system is currently in a preview state. Functionality might change in the future.
When you click the Plan Versions button, Bixby Studio shows a bar at the bottom of the execution graph window that lets you step through the execution plan. Plan Versions give you deeper insight into how modeling decisions control Bixby's dynamic program generation.
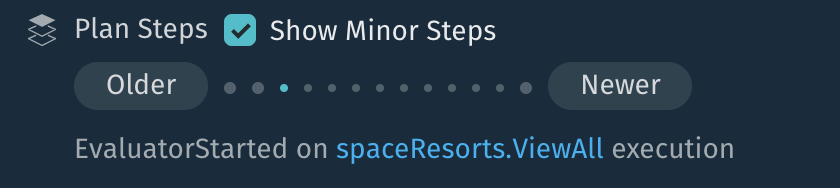
Use the Older and Newer buttons to move back and forth in the plan history. (You can also use the keyboard shortcuts Ctrl+K and Ctrl+L on Windows and Linux, or Cmd+K and Cmd+L on Mac.) As you change the state, you can see values in the graph populated. The notation at the bottom of the plan versions bar indicates the event that most recently modified the plan. Check the Show Minor Steps button to show internal processing events, such as the evaluation of nodes and sub-actions within graph steps.
The Inspector
The right side of the Debug Console window displays information about the models and functions used in the query or, if a node in the execution graph is selected, the models and functions used in that node. The Inspector is itself divided into two panes.
The top pane contains a list of stacked sections that expand or collapse when clicked. These include Actions, Concepts, Functions, Dialogs, and Conversation. When expanded, each section displays a result data structure as a tree of key-value pairs and arrays. "Branches" of the tree can be expanded by clicking on the ⊕ icon to the left of a key name. The icon will change to ⊖ when it is expanded. The size of arrays will be indicated in brackets (for example, "results [1]").
The bottom pane is the X-Ray Pane. Click any individual element in the Inspector to display more detailed information about the selected item:
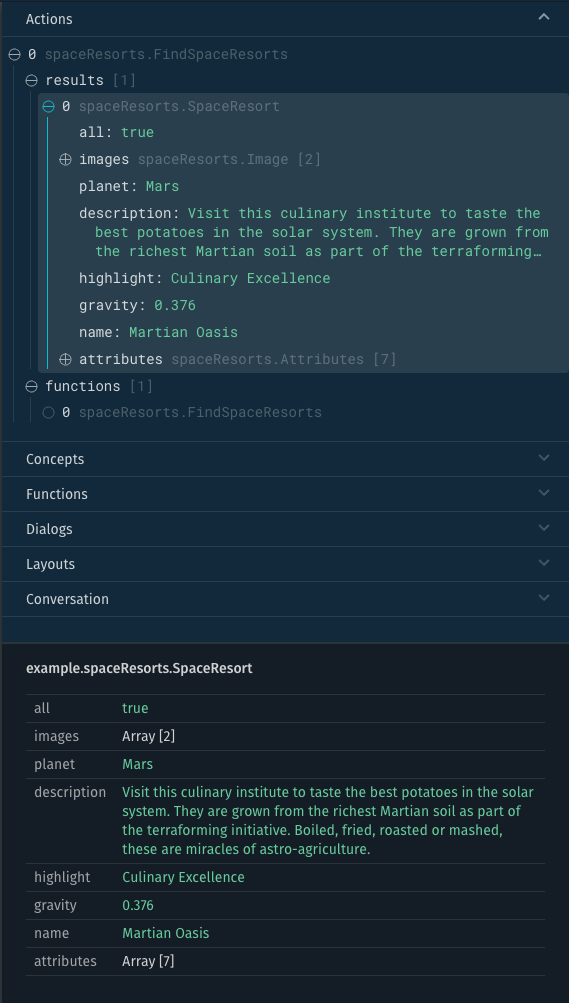
In this view, results is selected under the spaceResorts.FindSpaceResorts Action. The X-Ray Pane shows that images is a two-element array.
Different sections have different displays and functionality, depending on the context of the element being inspected.
Concepts and Actions
Concepts and actions display the values of the models being used in the query execution, or at the specific selected node along the execution graph. All of the values for models can be displayed entirely within the Inspector by expanding their levels in the data structure tree.
In this example, the action section is expanded:
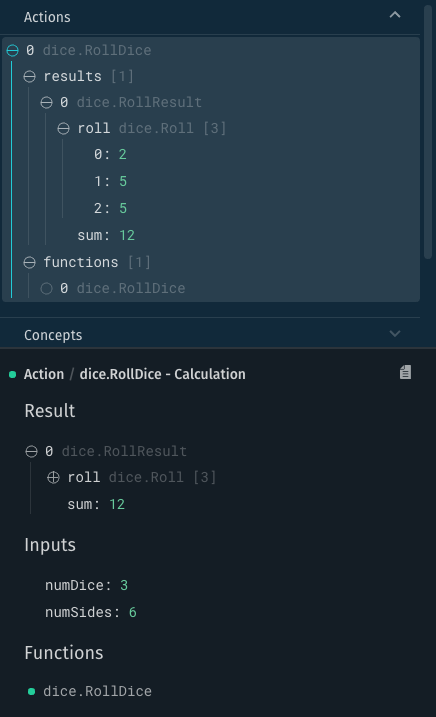
This shows us the following:
- The
dice.RollDicecalculation action was called. Clicking the document icon in the X-Ray pane will open the file for that model for editing. - The action's result is
dice.RollResult, with 3 dice rolled for a sum of 12. - There are two inputs,
numDiceandnumSides. - The
dice.RollDicefunction implements the action. (See Functions below for more details on this.)
Functions
Functions are annotated in the X-Ray Pane with colored dots (or collapse/expand icons) to denote whether the function executed successfully: green indicates success, and red indicates failure. You can "drill down" in the function section to find the specific error. In this example, viv.geo.Autosuggest failed to find a country for the user input "is it raining in helsinki", and displays an EmptyOptionalValue error:
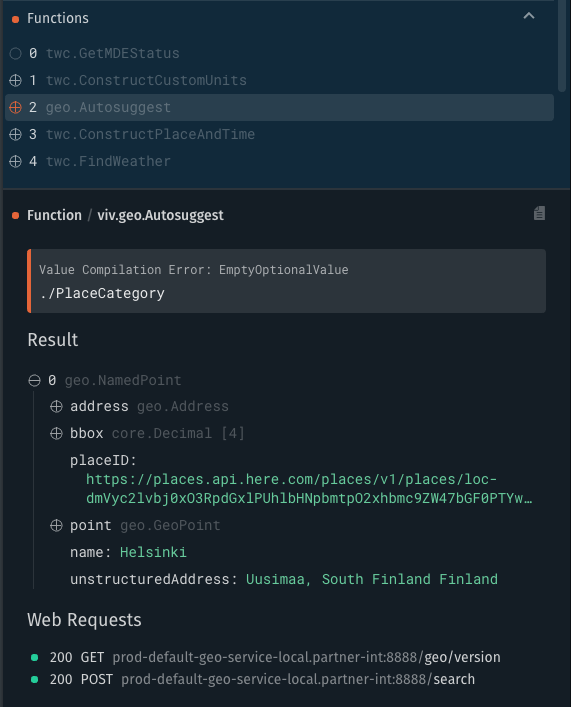
In this display, note that the JSON return value of the function is displayed with its types, and disclosure (⊕) icons to expand them to display their full values. Also, note that this function made a GET web request that returned HTTP 200, and was successful, as denoted by the green dot. Lastly, you can open the endpoint containing this function directly from the X-Ray Pane by clicking the document icon in the X-Ray Pane (to the right of the function name).
Dialogs
Dialogs, like Concepts and Actions, have data structure trees that can be inspected, showing each final dialog output along with the templates and concepts used to construct it. Here's example dialog from a recipe searching capsule, after the user has requested Bixby to find recipes with chicken and tomato, but without rice:
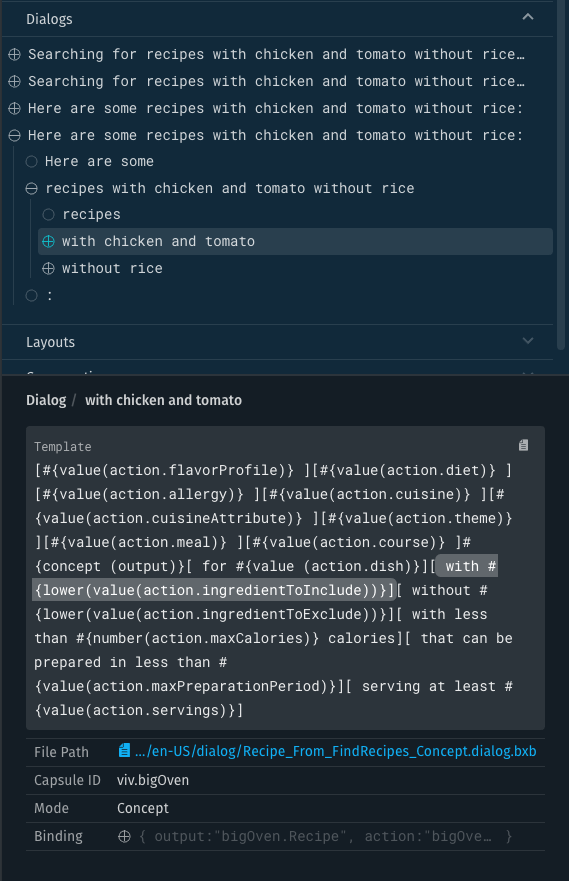
In the X-Ray Pane, the template for the selected utterance (the phrase with chicken and tomato) is shown, along with the file containing the template, concepts and their bound values, and other metadata. Click on the file path to open the file in Bixby Studio.
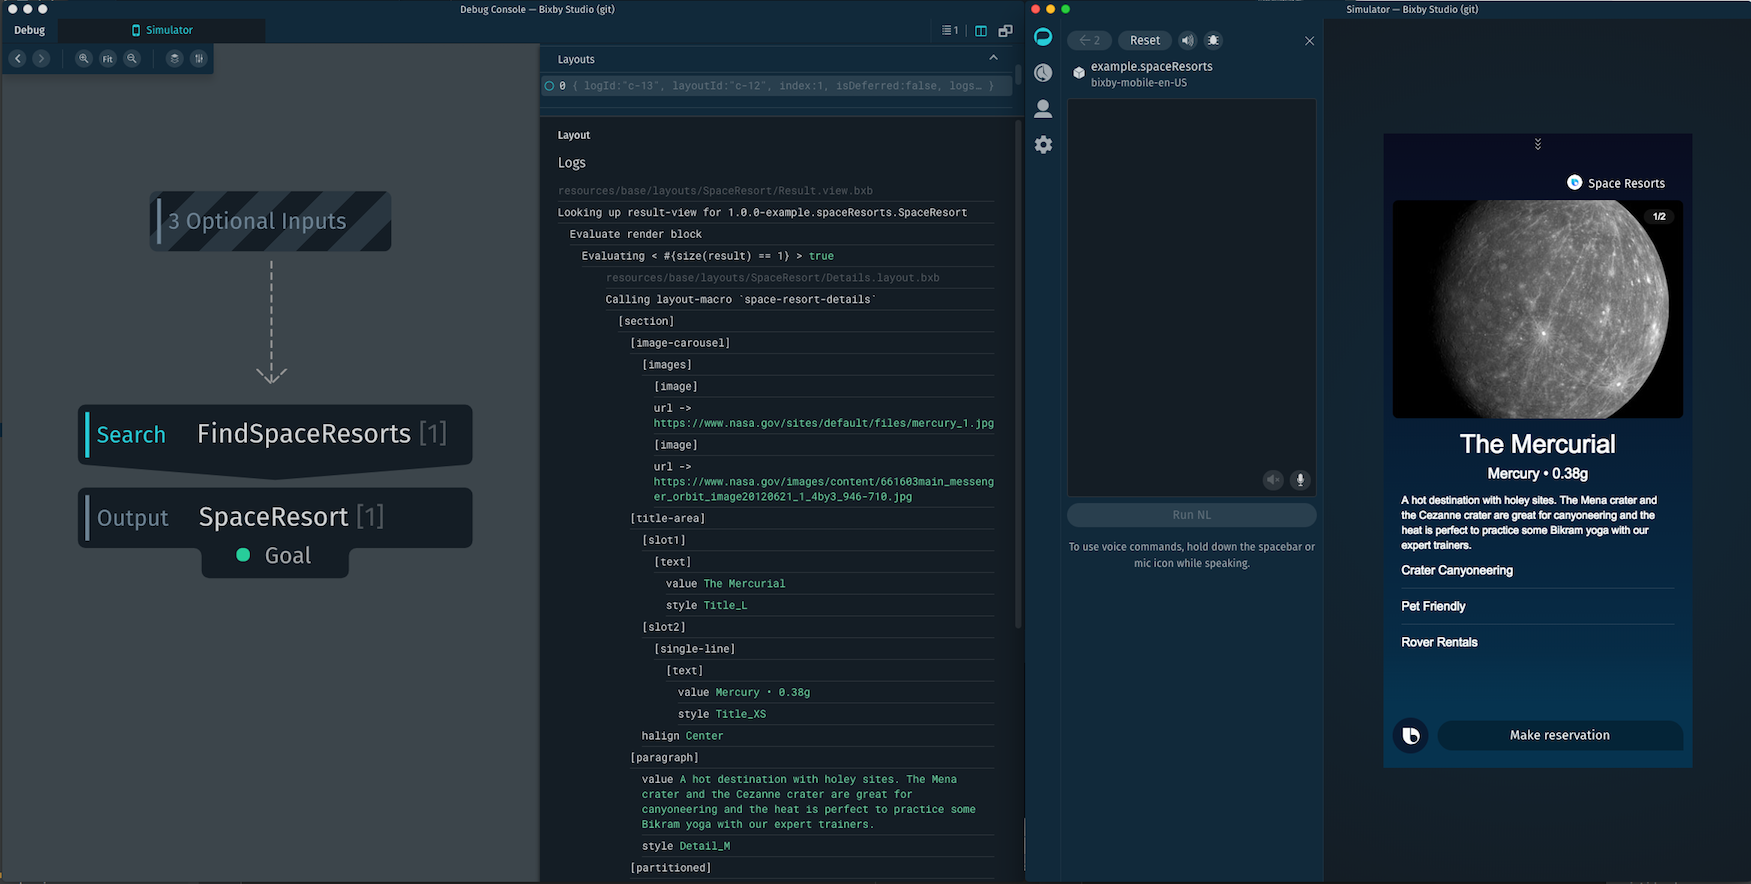
Layouts
The Inspector displays layouts in the same fashion as it does most other models.
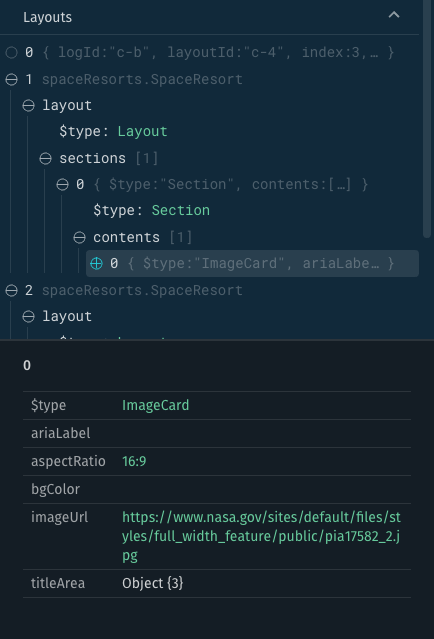
You can inspect layouts used in the execution of the query, displayed as a key/value tree showing the sections, view components, and values.
The first section available in the layout debugger is a logger, which lists the steps shown in choosing which layouts and view components to present. In this example, you can compare the rendered layout (on the right) with the debug layout logs (on the left).
Conversation
The tree in the Conversation section will show you how Bixby has parsed the user's utterance.
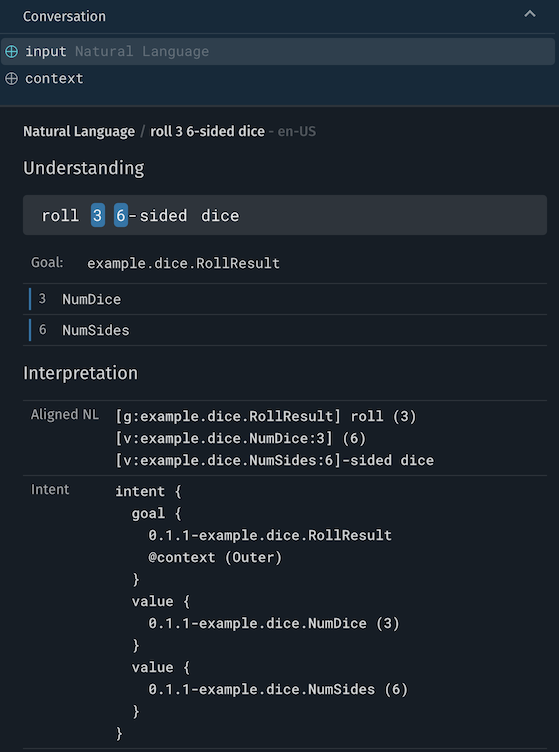
Understanding shows the user's natural language input: "roll 3 6-sided dice". Under that, Bixby shows you the goal and concept inputs that it's matched to the natural language.
Interpretation shows how Bixby understands this input. First, it shows the Aligned NL:
[g:example.dice.RollResult] roll (3)[v:example.dice.NumDice:3]
(6)[v:example.dice.NumSides:6]-sided dice
And from that, Bixby generated the following intent:
intent {
  goal {
    0.1.1-example.dice.RollResult
    @context (Outer)
  }
  value {
    0.1.1-example.dice.NumDice (3)
  }
  value {
    0.1.1-example.dice.NumSides (6)
  }
}
You can also use the Conversation inspector to display the user context used for processing this user request. Expand the context tree to see the values used. These are device-specific, and might be different when testing on actual devices rather than the Simulator.
Issue Inspection
When there's an error in execution, the Debug Console will display information about the problem:
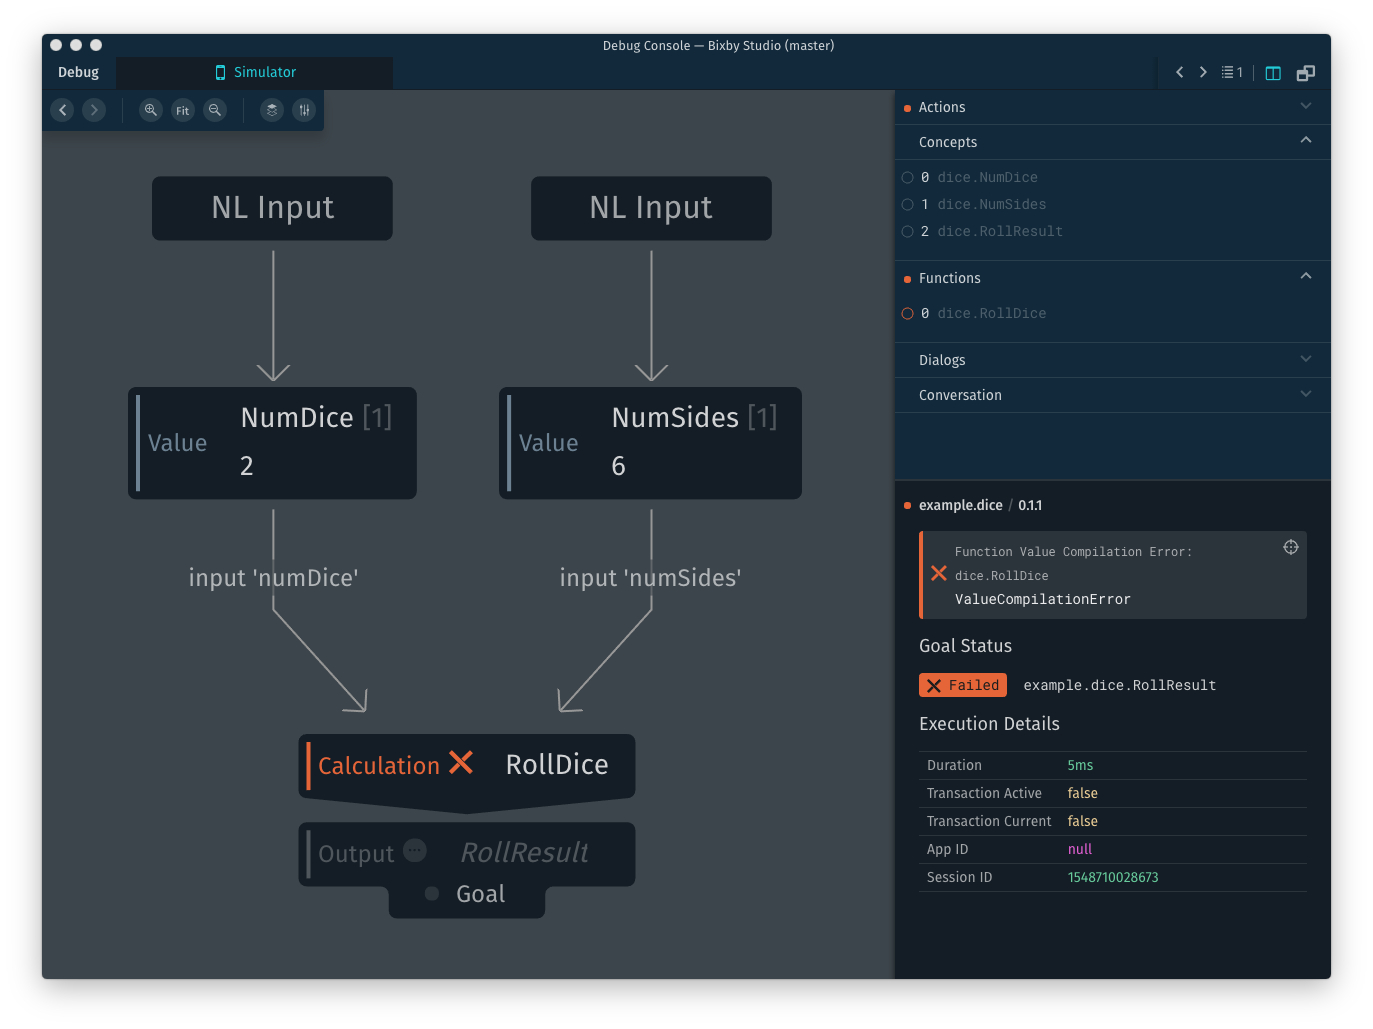
In this case, an error has happened in the RollDice step: the node in the execution graph is red and marked with an X. The X-Ray Pane identifies this as a ValueCompilationError. Clicking the round crosshairs icon (⨁) in the upper right corner of the function failure message shows the function generating the issue:
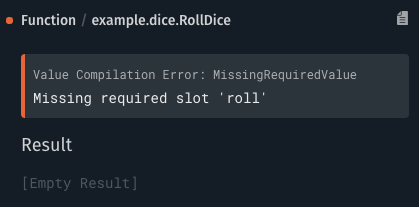
The viv.dice.RollDice function hasn't returned the required roll value. Clicking the document icon in the upper right corner will open the function's JavaScript source file in Bixby Studio for you to investigate.
Issues might appear in the Debug Console without being fatal. For instance, an action that takes an optional value might produce an error when that value is not present. In non-fatal cases, the failing function might still succeed, and Bixby might process the query correctly.
Logging
You can use the JavaScript API's console functions (console.log, console.info, console.warning, and console.error) to send messages and data to logs that will be displayed in the Debug Console's Functions section.
Suppose that you add a logging statement to the findSpaceResorts function in the Space Resorts capsule:
export function findSpaceResorts(input) {
  const { name, planet, searchCriteria, $vivContext } = input
  console.log('searchCriteria:' + searchCriteria + ', planet: ' + planet)
  return main.findSpaceResorts(name, planet, searchCriteria, $vivContext)
}
When the query is executed, the logs can be selected and viewed in the X-Ray Pane:
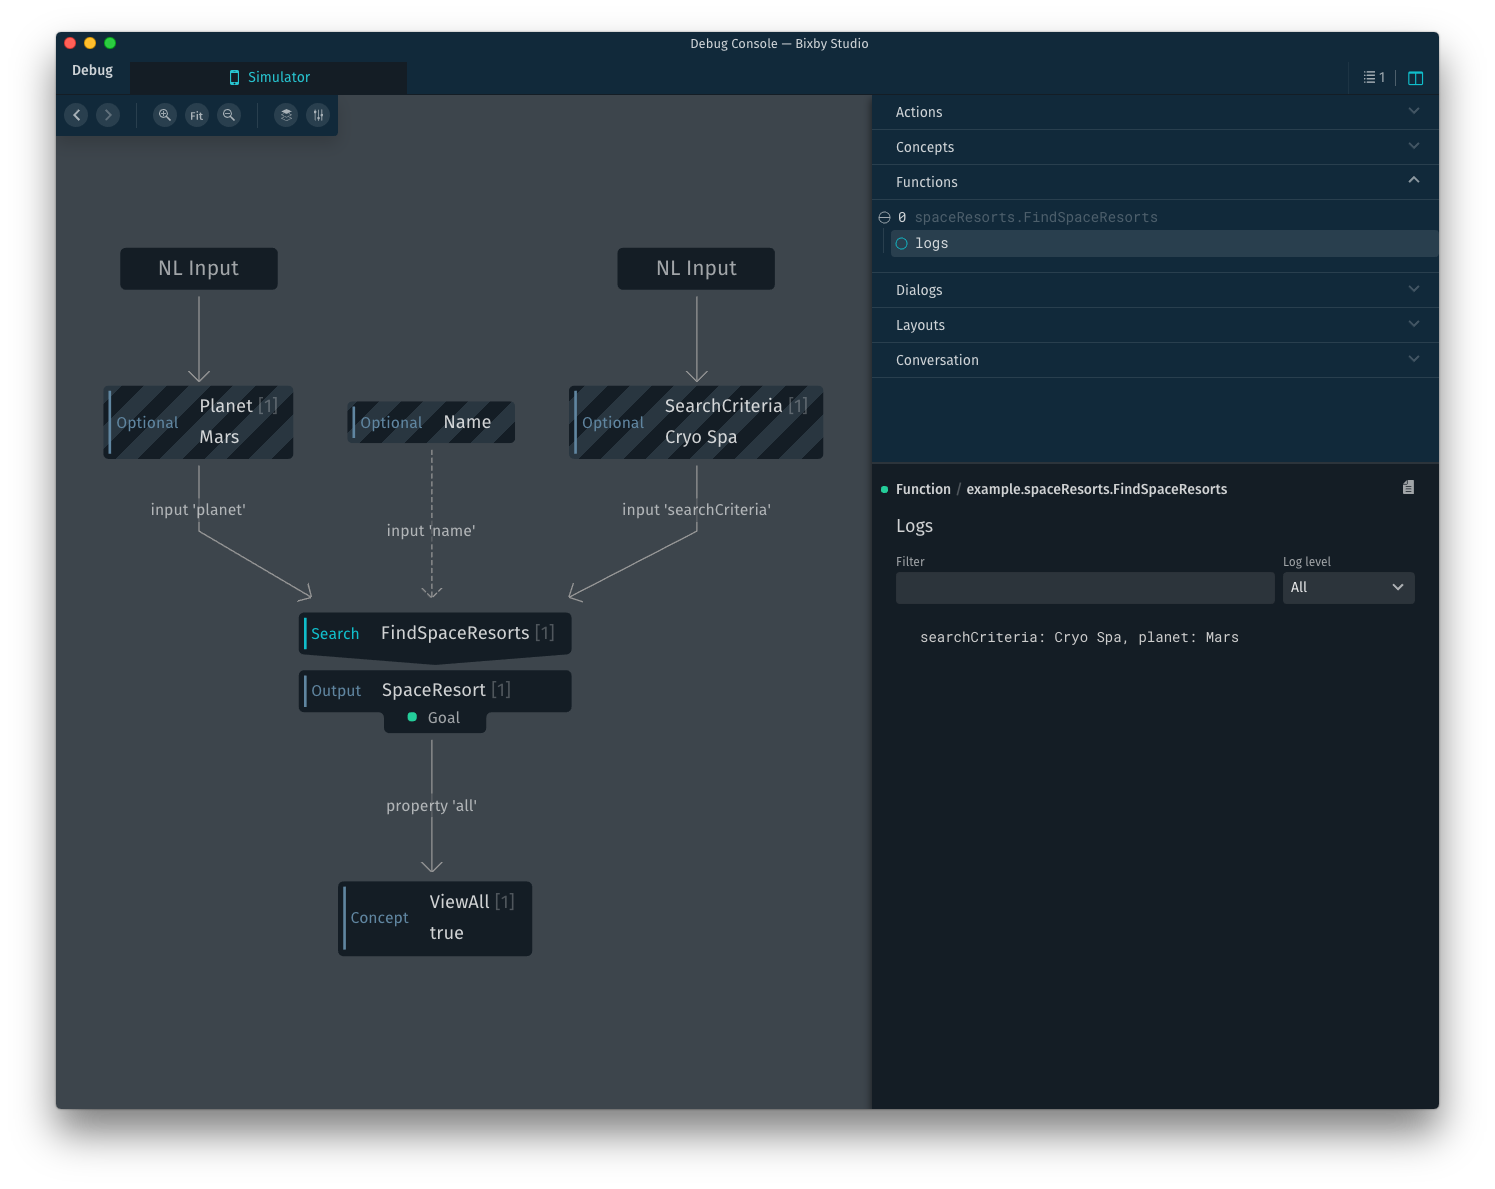
Longer logs can be filtered by entering text to match on in the "Filter" field. You can also choose to display only messages that match individual logging levels (info, debug, warning, and error).
Video Webinar: Debugging and Testing
The following recorded webinar shows how to debug and test your capsule.