2019 January - March
6.7.1 Bixby Developer Studio Release Notes
Updated: March 27, 2019
In this release, we didn't release any major features, but we did fix a number of bugs and made minor refinements to menus and shortcuts.
6.7 Bixby Developer Studio Release Notes
Updated: March 8, 2019
6.7 Submission Description Search
You now can search through your previous submissions within Submission History. Simply type and press Enter or Return to filter the results.
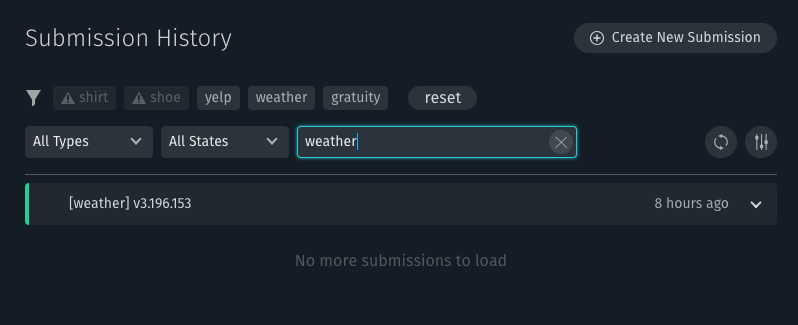
Currently, partial word search is not supported and delimited words, such as the capsule ID (example.capsule), are treated as one word.
Learn more about searching submission history.
Simulator Updates
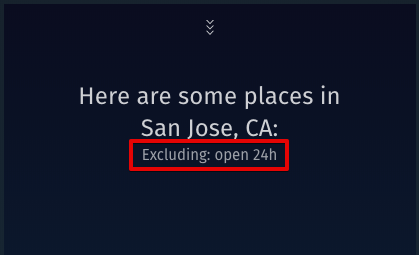
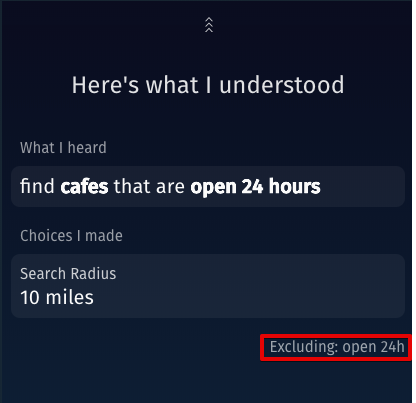
Relaxation Support and Improved Dialog
We've updated the Simulator to show when relaxation occurs. We've also made overall improvements to how dialog is shown.
6.6 Bixby Developer Studio Release Notes
Updated: March 4, 2019
On-Device Testing
In addition to the Simulator, you now have the ability to test your capsule on a Bixby-enabled device. Testing on device lets you see the actual end-user experience.
To test on a device, you must use a compatible device and make a private submission.
Learn more about On-Device Testing.
ASR and TTS Capability in the Simulator
Bixby Developer Studio now has text-to-speech (TTS) and automatic speech recognition (ASR) capability in the device simulator.
When TTS is enabled, the Simulator speaks Bixby's dialog aloud.
When you use ASR, your speech is transcribed in real-time into the Simulator's input window while you hold down the microphone icon or spacebar, and the query is run when you release the mouse button or spacebar.
Learn more about Testing Speech.
Miscellaneous Enhancements
When you use Plan Versions in the Debug Console to navigate through the execution plan, the graph now retains state.
In rare error cases where workspace components in Bixby Studio hang due to rendering issues, Bixby Studio can now catch these and let you recover by reloading the editor tabs or the entire workspace.
A bug in the Debug Console that could cause action input values to display as reference IDs rather than the actual values has been fixed.
6.5 Bixby Developer Studio Release Notes
Updated: January 28, 2019
6.5 Debug Console Updates
Selection History
In this release, you can now retrace your selections within the Debug Console using selection history.
If you select nodes within the execution graph, or if you select sections of the X-ray Panel, you can click on the left and right arrow buttons in the upper left corner of the Debug Console to navigate through previous selections.
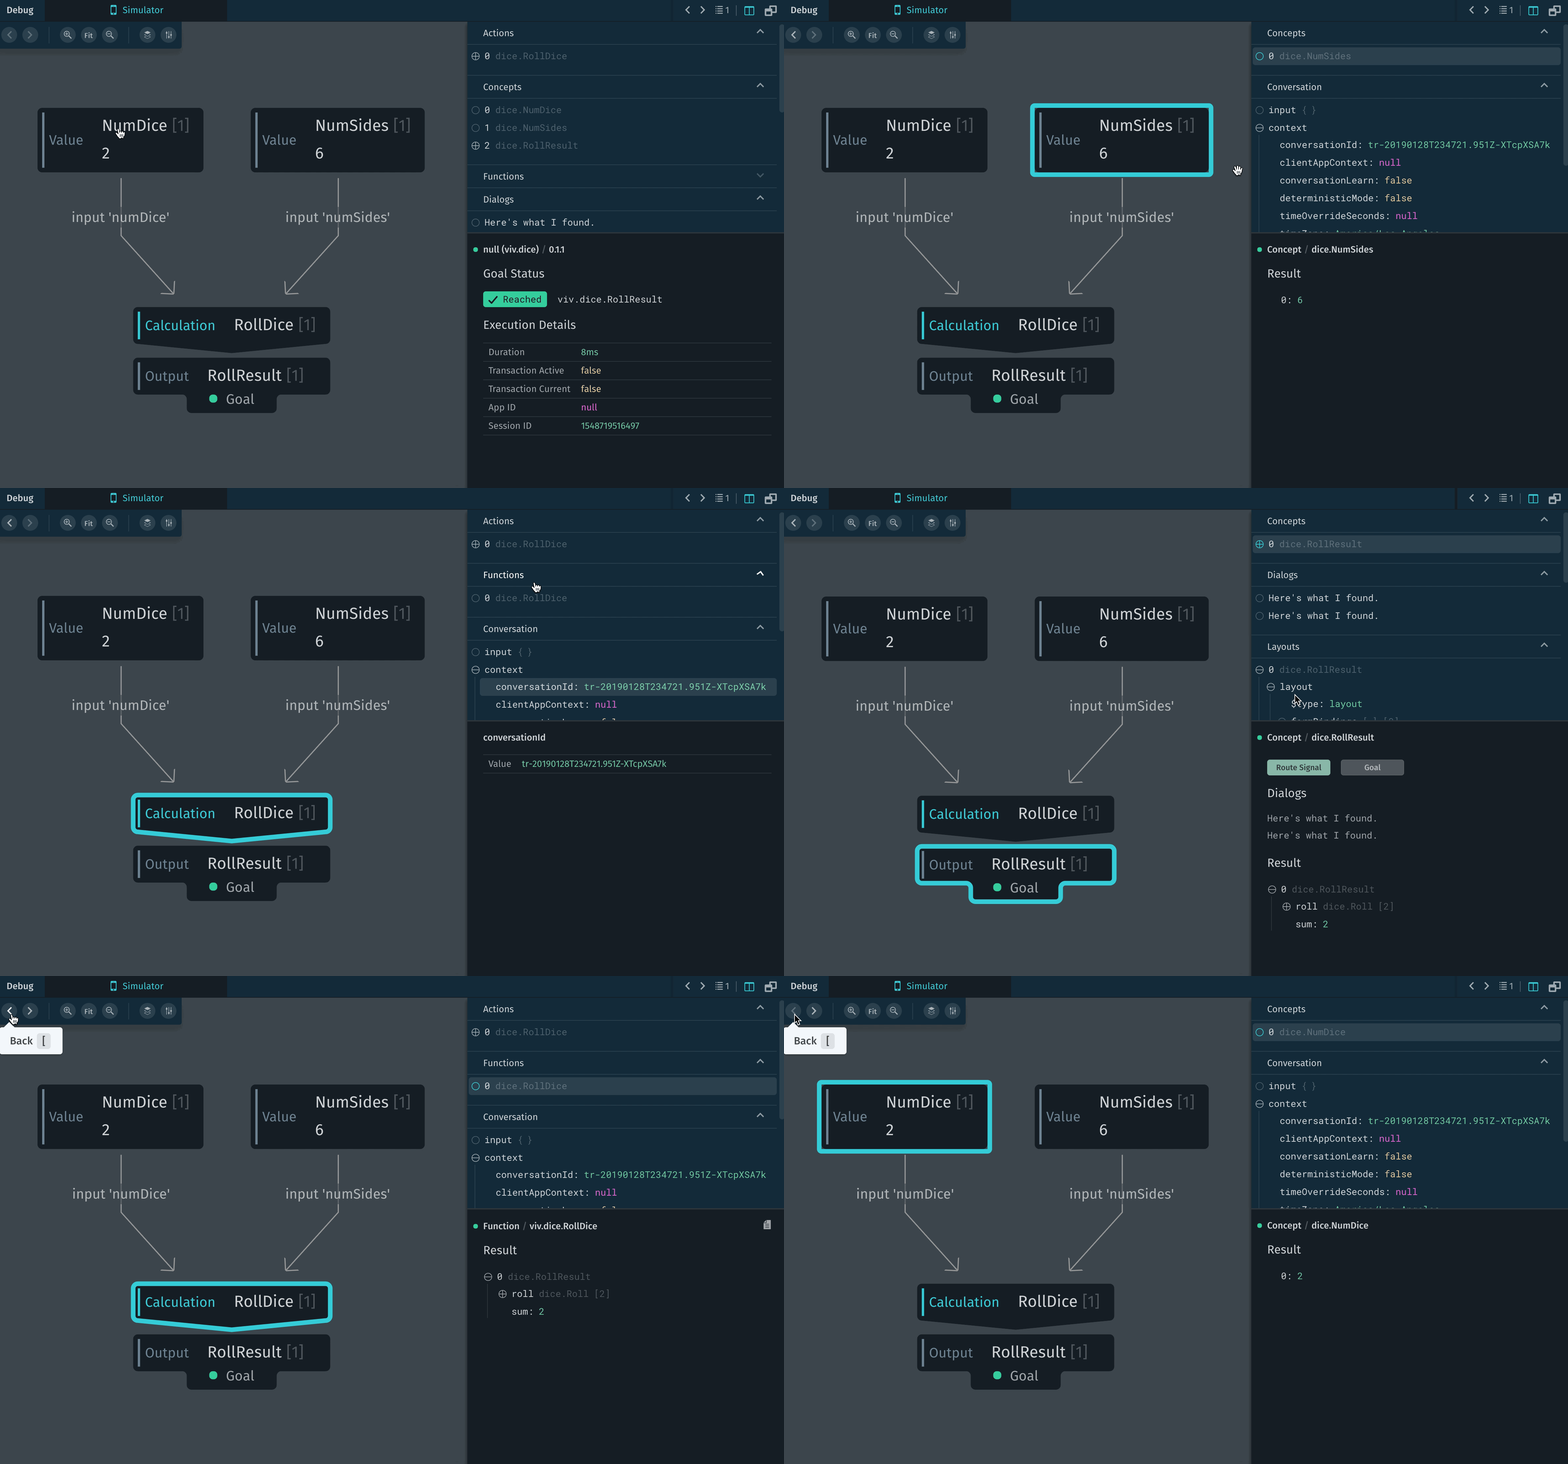
Learn more about selection history within the Execution Graph.
6.4 Bixby Developer Studio Release Notes
Updated: January 14, 2019
In this release, we've fixed a bunch of bugs and added some notable features to the Debug Console and Simulator.
6.4 Debug Console Updates
Plan Versions
When using the Debug Console, you can now use Plan Versions to follow each step of plan execution.
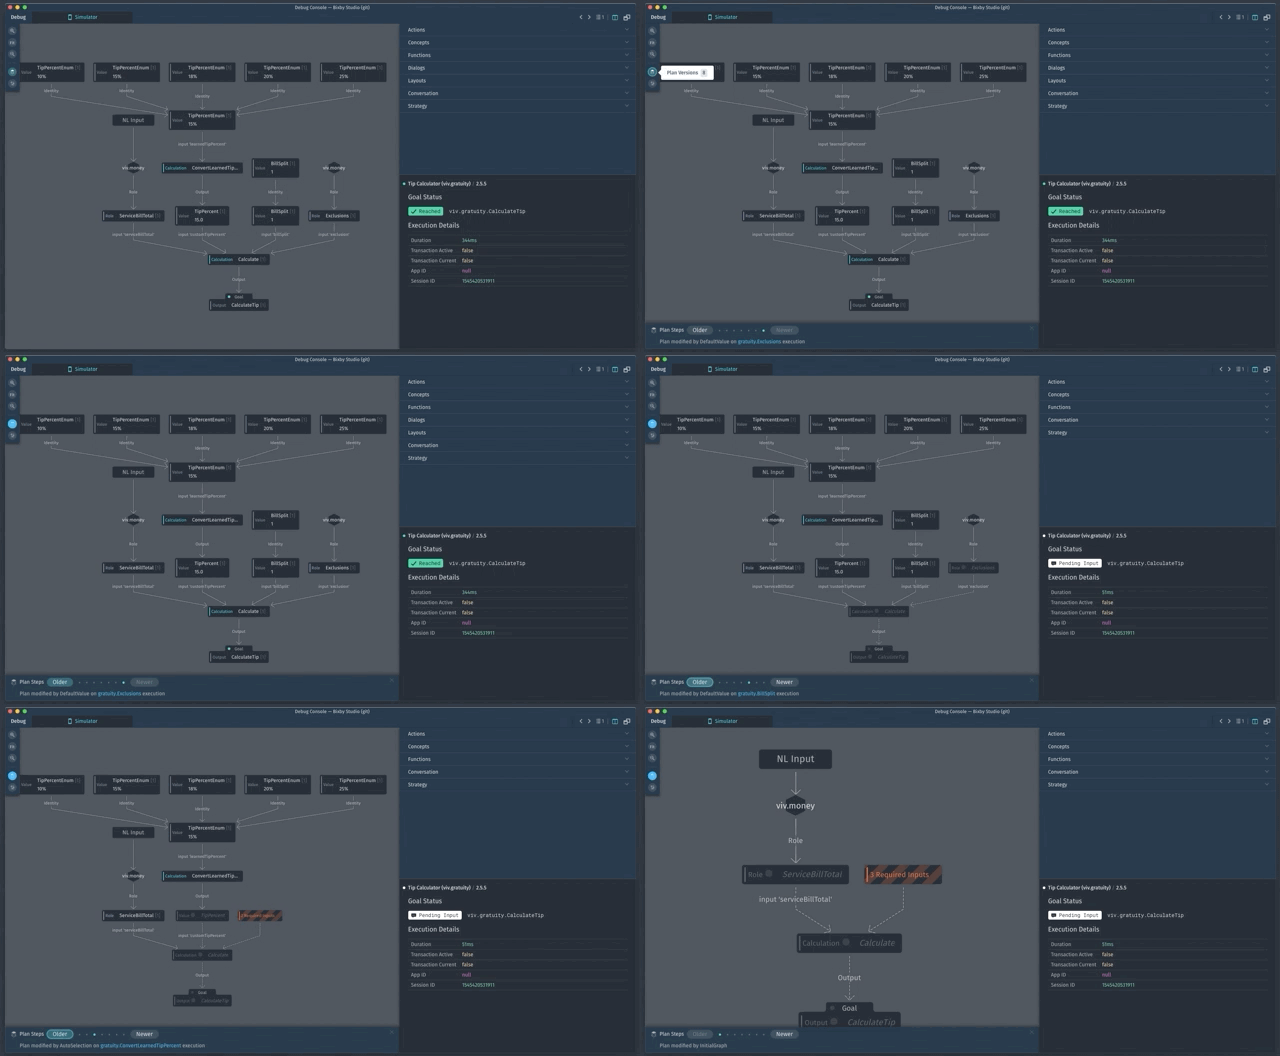
After you run an utterance or Aligned NL, you can open the Debug Console and click the Plan Versions button on the left side:
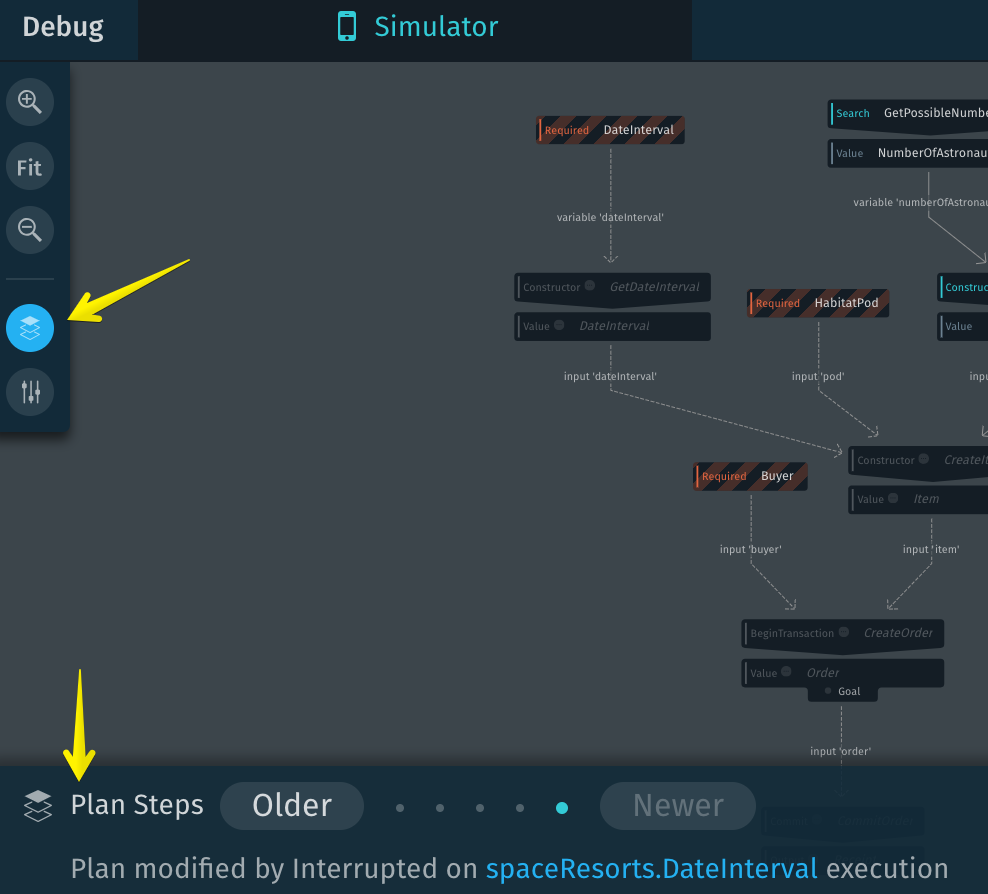
Use Plan Versions as part of your debugging to see to see what nodes are affected at each step and to see why plan modifications occur.
Plan Versions is currently in a preview state. We'll be adding more functionality to it in the near future.
Learn more about Plan Versions.
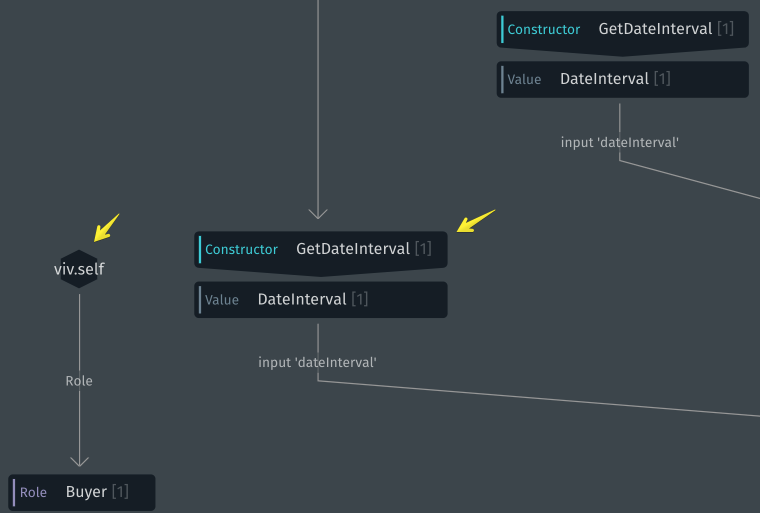
Updated Plan Graph
We've further refined the design of the plan graph. For example, we now provide a new look with actions pointing to the connected output and hexagons representing imported capsules:
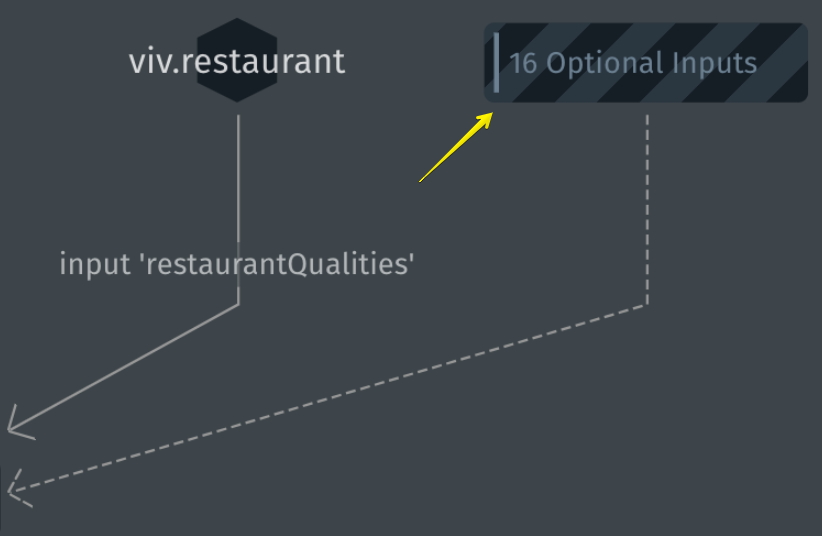
Optional Inputs with No Data Now Collapsed
We've fixed a bug that previously expanded all optional inputs even when there was no data for those inputs. Now, any optional inputs without data are collapsed into a single node marked Optional Inputs.
6.4 Support for App Launch in the Simulator
If your capsule launches an app, the Simulator now allows you to preview this functionality, though it does not actually launch the app. You can also see a log of metadata associated with the app-launch feature:
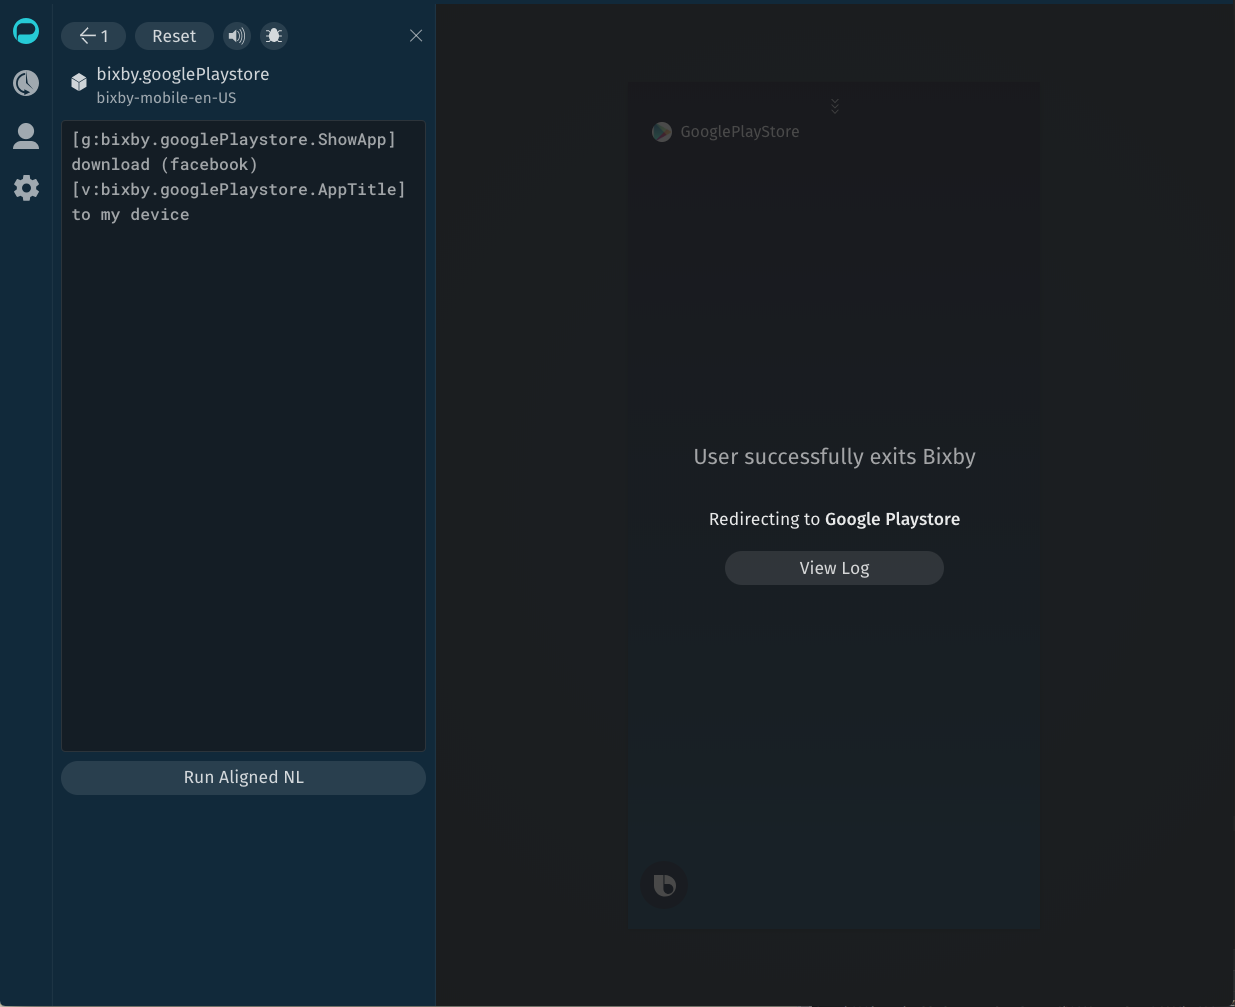
Learn more about simulating app-launch.
Bixby Developer Studio
New Capsule Manager
We've updated Bixby Developer Studio so that you no longer have to go to settings to manage capsules.
You can now create, remove, sync, and unsync files using the capsule manager available above the file explorer pane:

Learn more about about managing capsules in the Files view.
Warning for Training Errors
We now warn you if you have a training file that has a syntax error in it. As a reminder, you should not manually edit training files. Doing so can result in syntax errors.