
Using Bixby Home Studio
Bixby Home Studio (BHS), a web-based development environment, helps developers design the voice interfaces between the Bixby virtual assistant and smart devices registered with SmartThings. In BHS, you create logical action flows using connected nodes and save them in voice metadata files. You can add intelligence to the voice commands by creating voice metadata. You can also test your action flows and submit them for testing, review, and release (available to the user).
Launch and Configure Bixby Home Studio
Launch BHS in your browser by visiting https://bhs.bixbydevelopers.com.
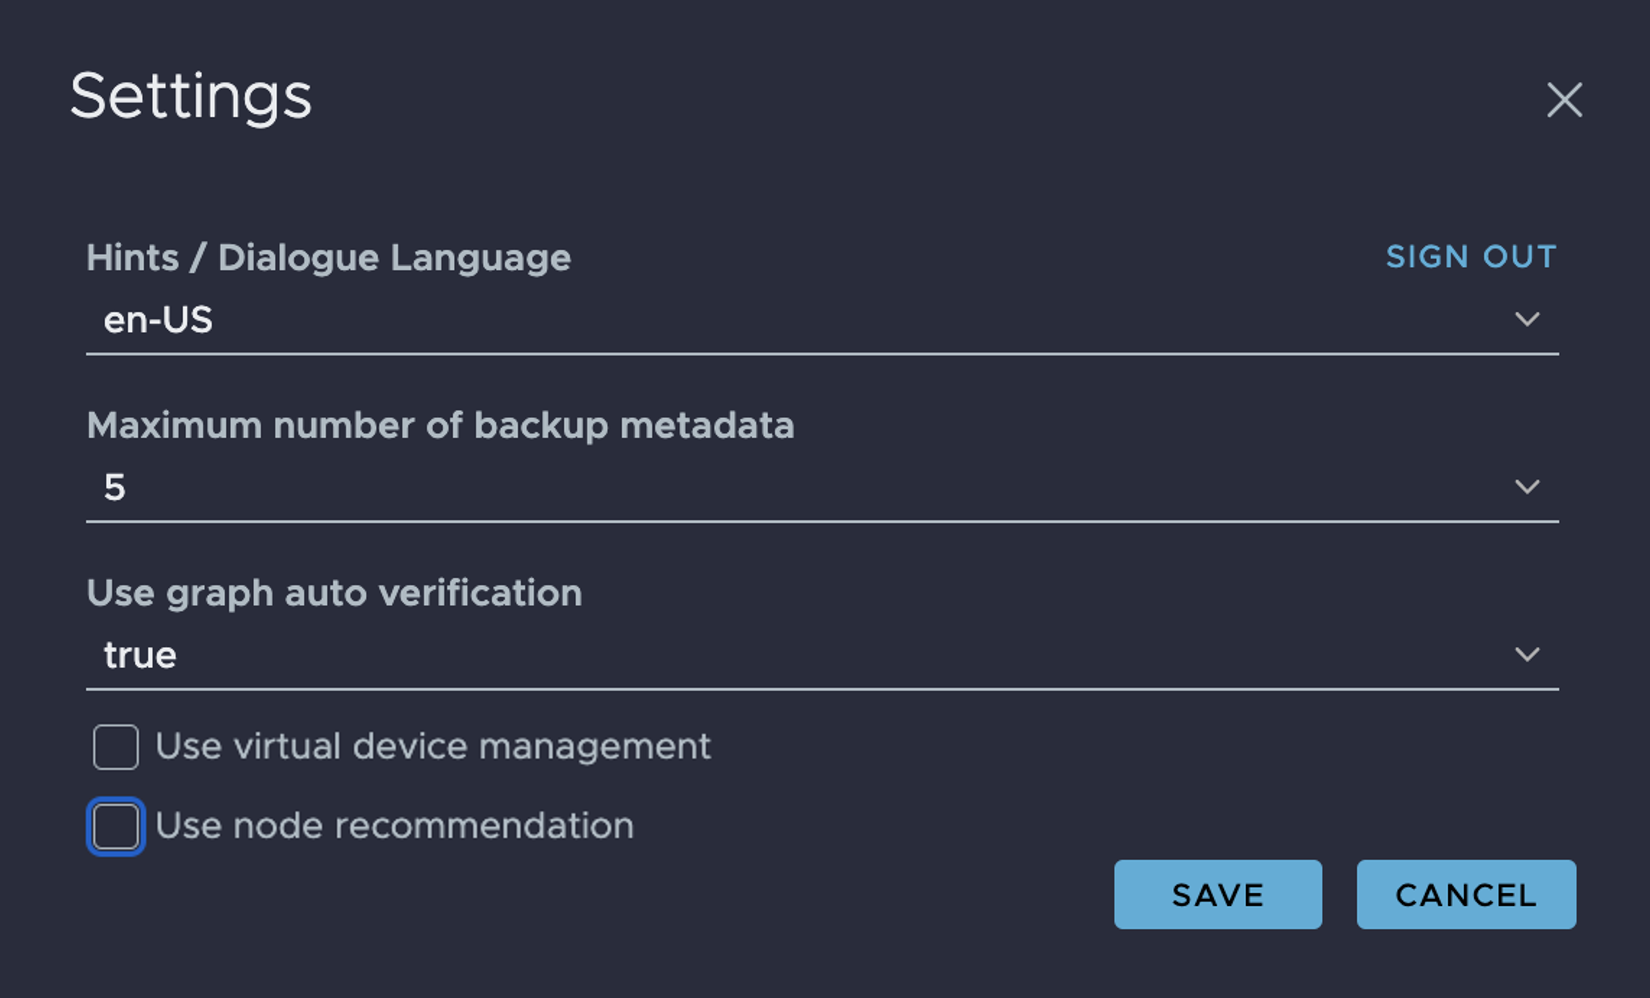
BHS displays the Settings window. If you're not logged in to your Samsung Account, you'll receive a prompt to sign in.
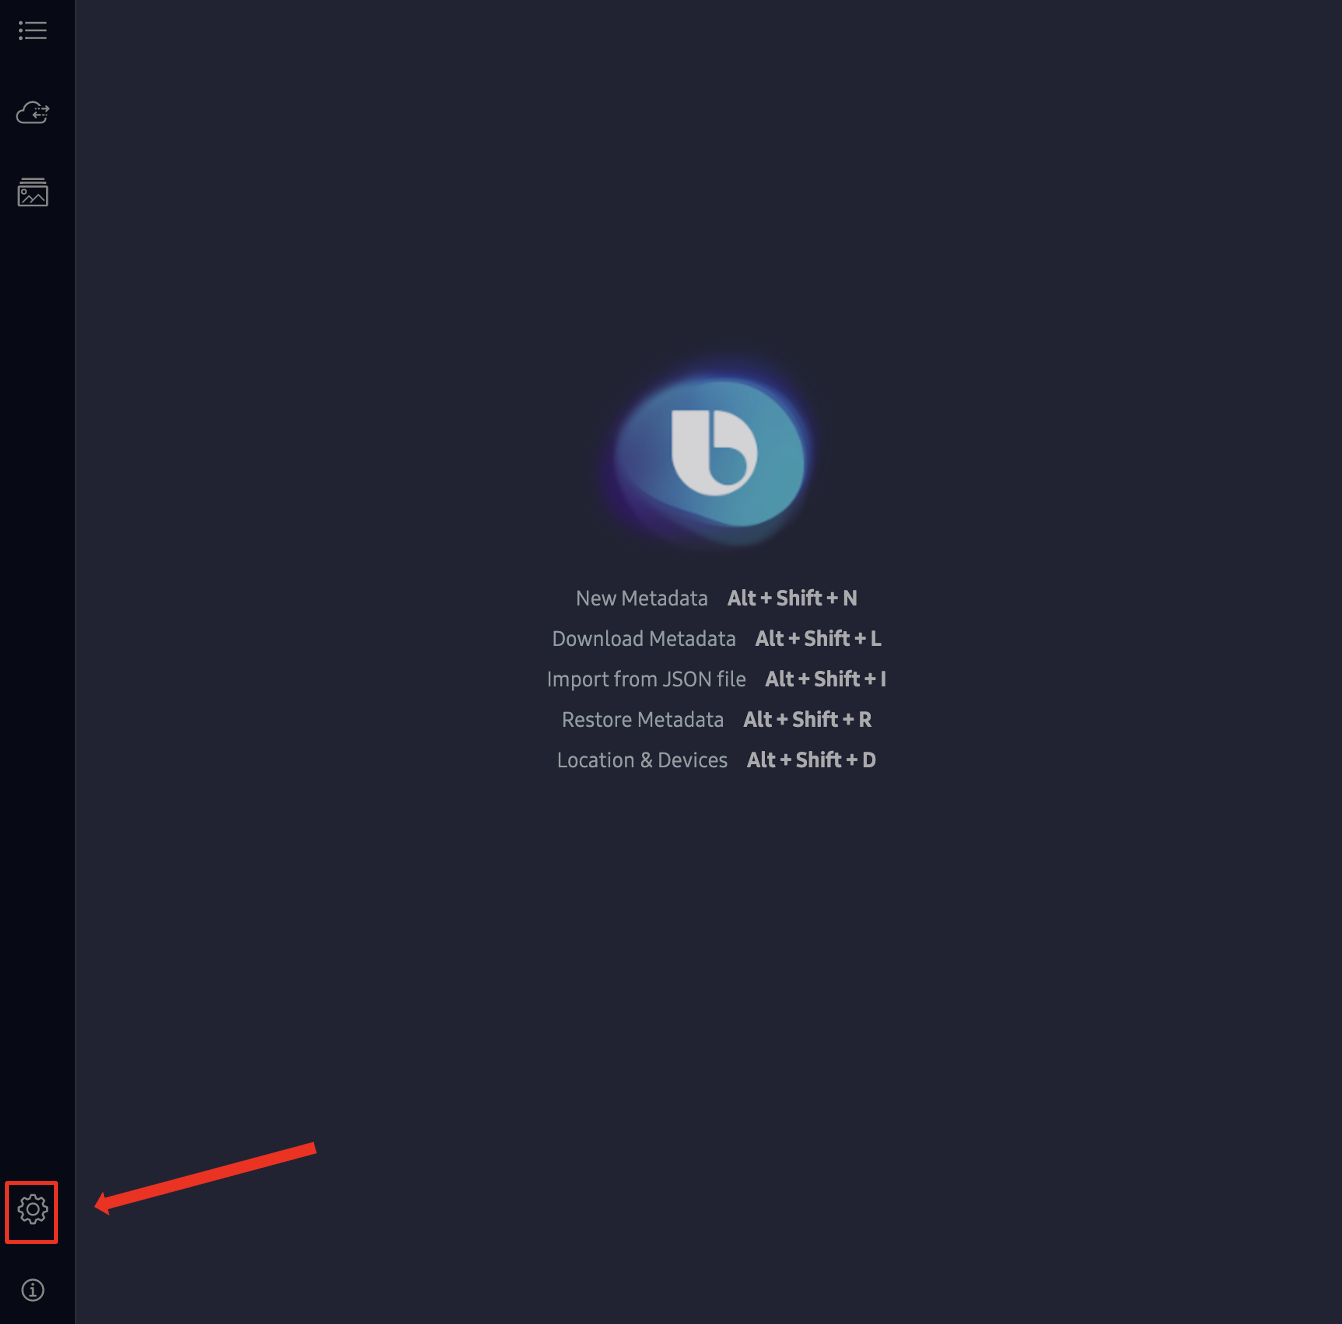
If BHS doesn't open the Settings window by default, click on the Settings icon towards the bottom of the left-side menu bar.
You can configure BHS for your device in the Settings window:
- Select the preferred language for testing purposes under Hints/Dialogue Language.
- Select the maximum number of backups for metadata.
- Click on Save.
You can also select the Use node recommendation feature.
Use Node Recommendation
When enabled in the Settings window, the Use Node Recommendation feature allows you to see recommendations for next possible nodes while creating action flows.
The recommendations for next possible nodes are based on graph properties, such as currentNode, previousNode, deviceType, capability, action, triggerType, and node category.
To add a recommended node to your action flow, do the following:
- Hover over a node's
triggerOutport. A popup appears to the right of the node with the name and description of thetriggerOutport and recommended nodes.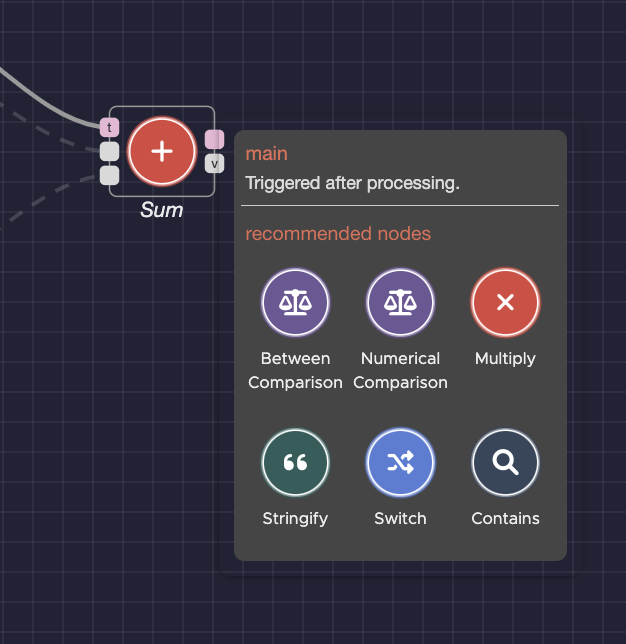
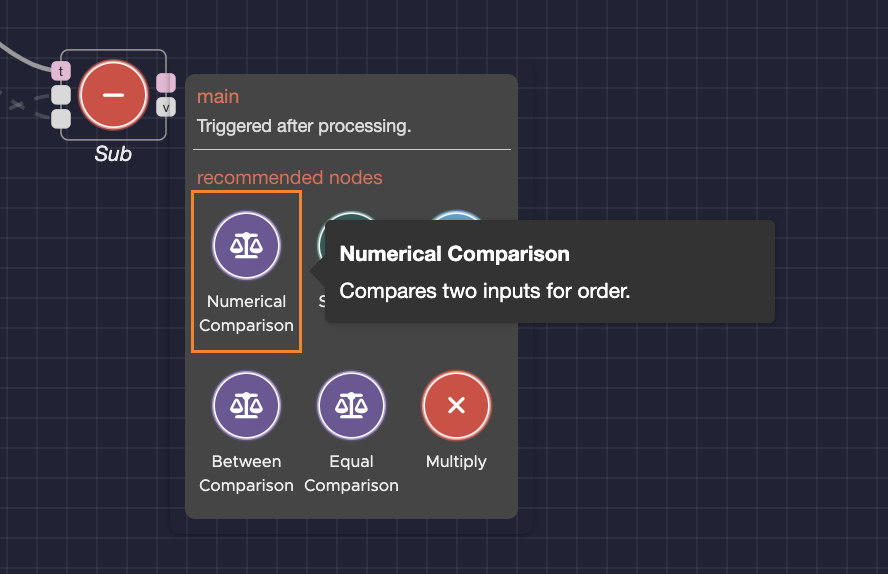
- Hover over a node in the selection to read a description of that recommended node.
- Click and drag a recommended node, based on the action flow logic, to the graph.
Configure a SmartThings Device
Connecting a SmartThings device enables you to associate multiple voice capabilities with that device. At the bottom left of the screen, click the Device Details icon. A menu opens up.
Select a location to load the list of devices present in that location. Select a device from the list. Your device is now configured. You can create metadata for it, and then the action flows for the voice intents.
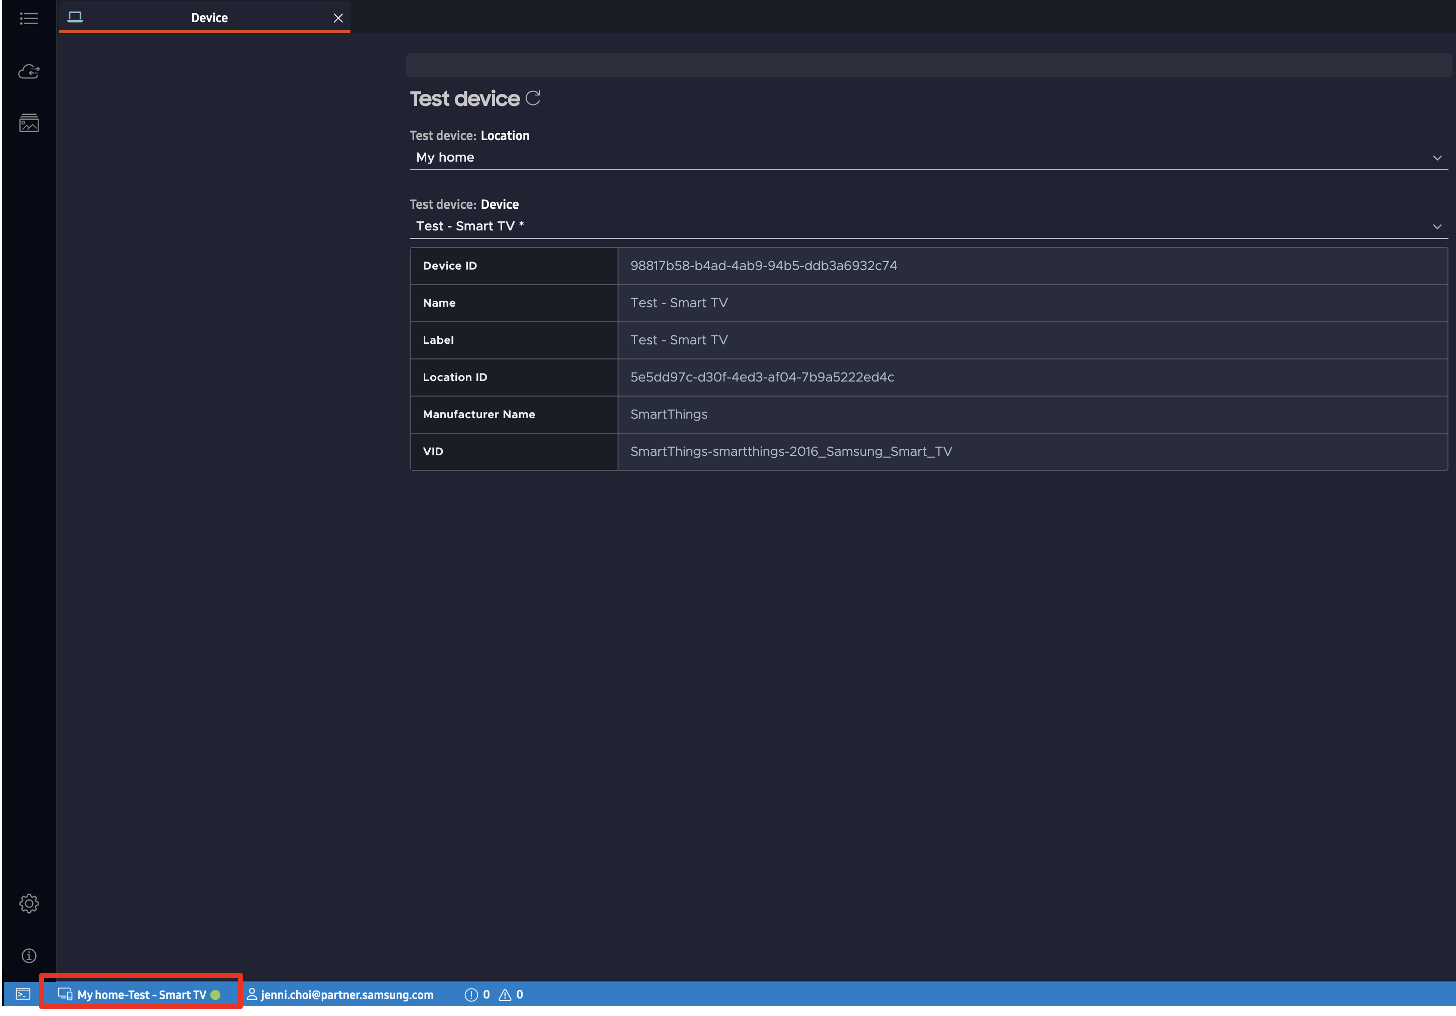
You will see the following device details in the window that appears after you click the Device Details icon:
- Device ID: This is the unique identifying number for the device.
- Name: This is the name of the metadata file.
- Label: This is the name that you assigned to the device.
- Location ID: This is the unique identifying number for the location, such as your home.
- Room ID: This is the unique identifying number for the specific location of the device, such as your living room at home.
- Manufacturer: This is the device manufacturer.
- VID: This is the vendor identifier number assigned to your device.
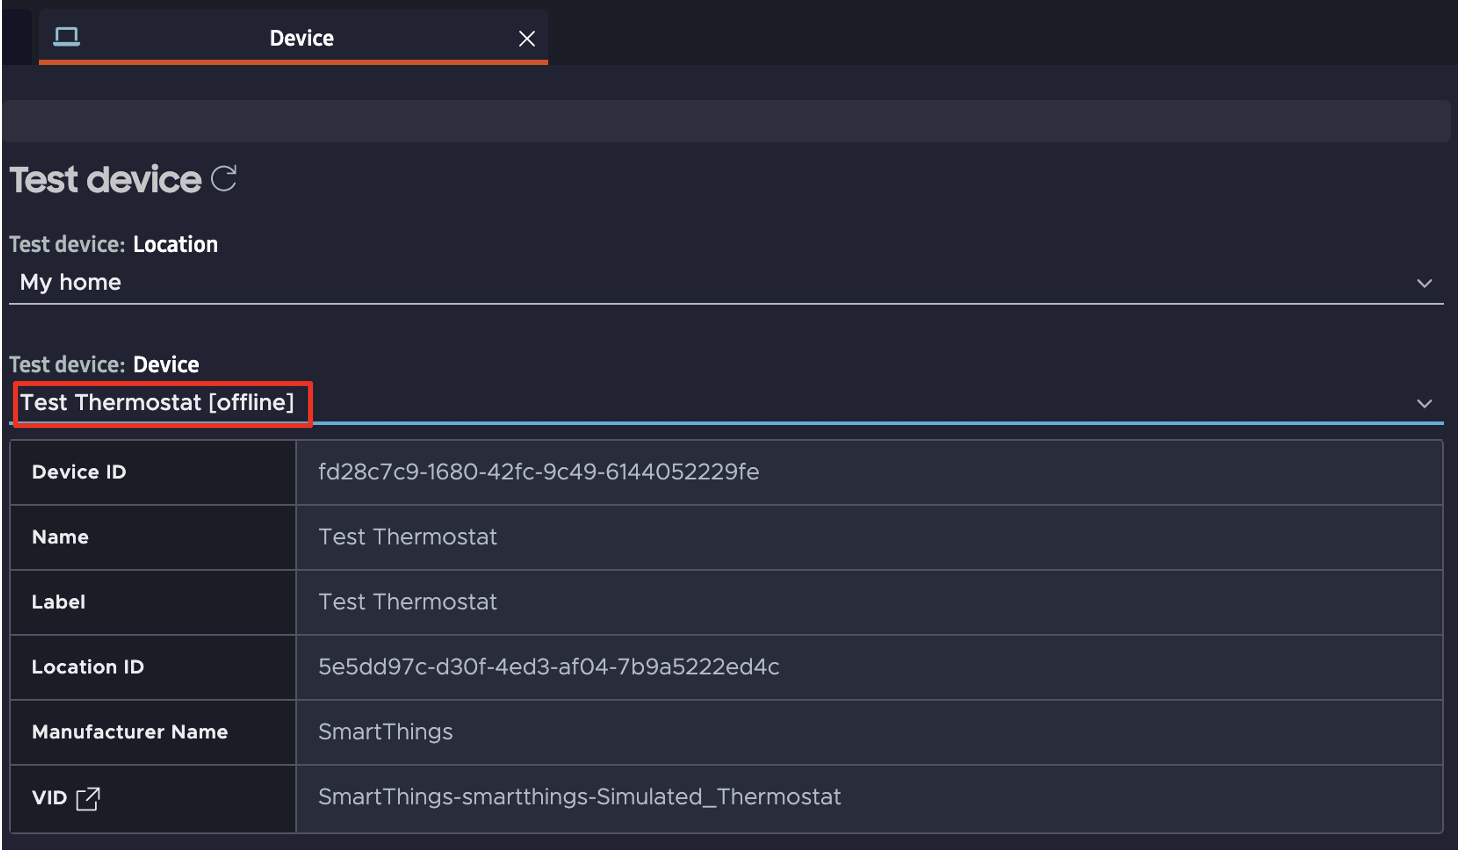
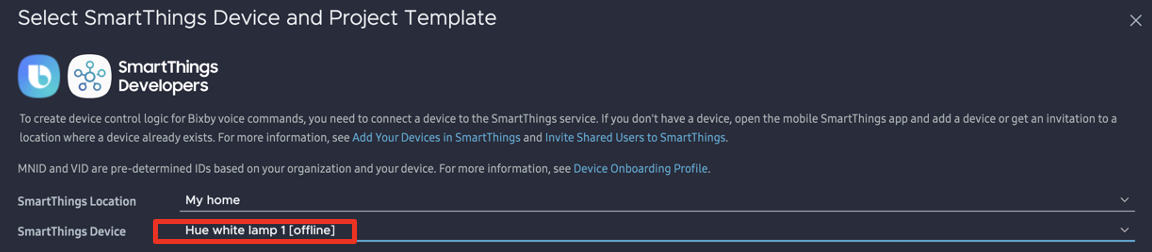
If a device is offline, then "[offline]" will be displayed next to the device name. The default status is online.
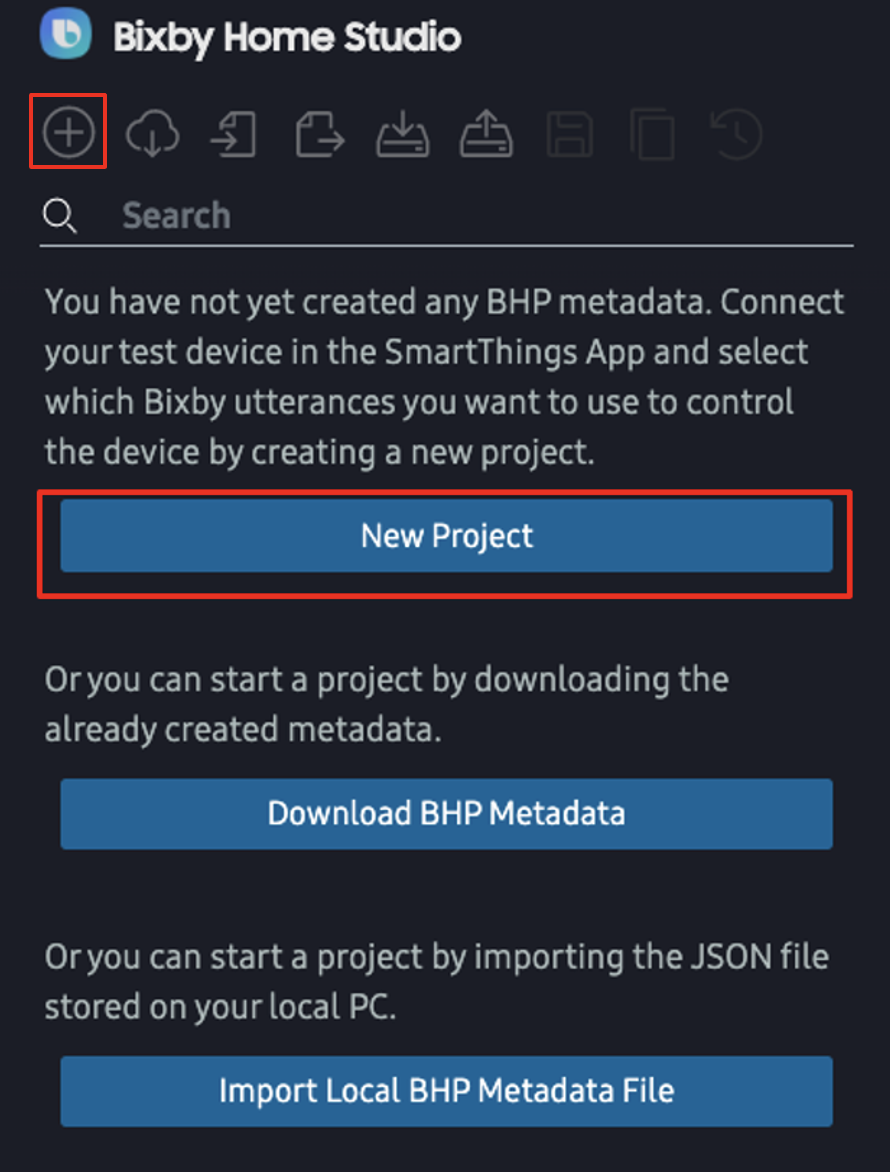
Create a New Voice Metadata Project
To create a new project, start by clicking the ⊕ icon in the left menu bar. If you haven't created any projects yet, you can also click the New Project button in the sidebar.
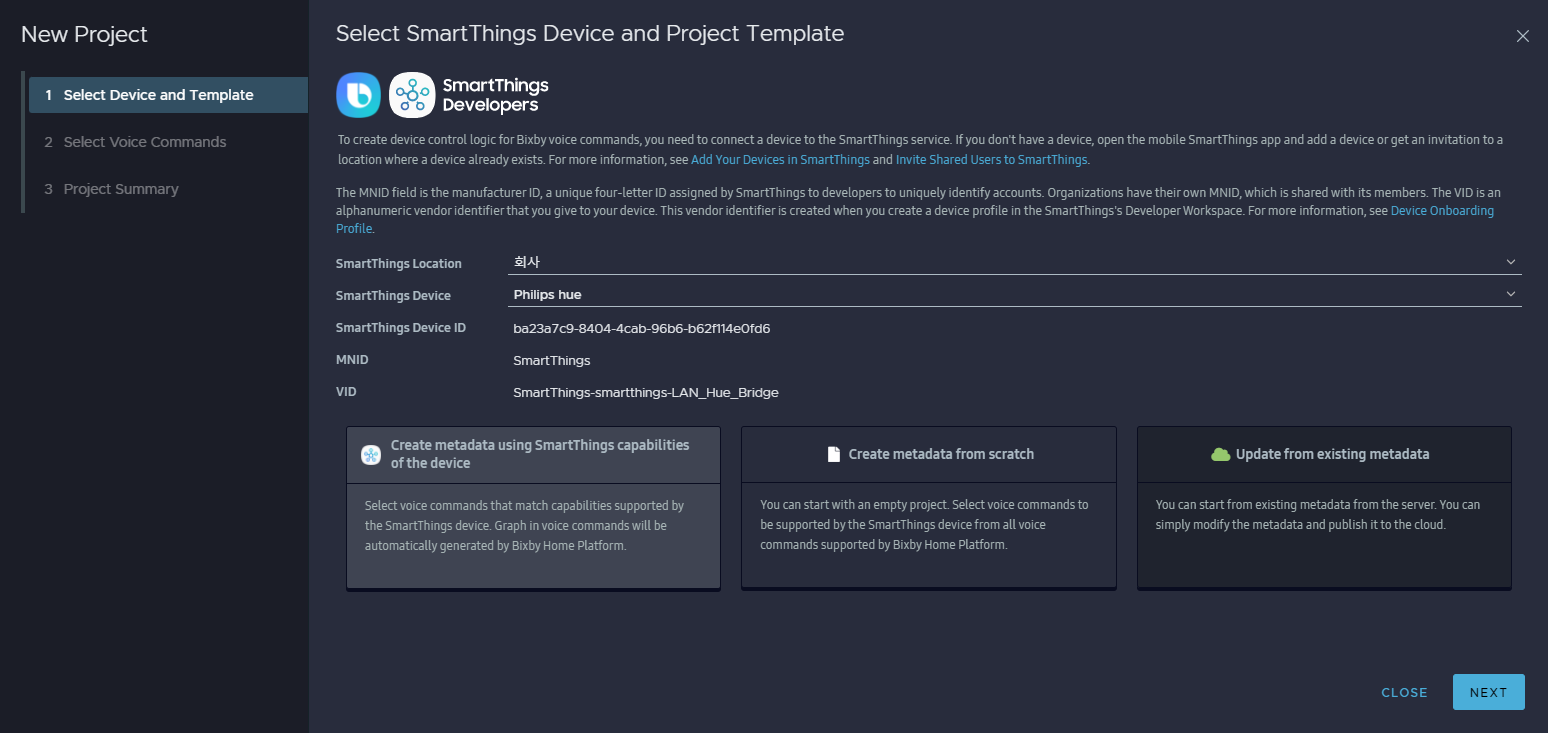
Choose Initial Metadata Creation Option
Select the SmartThings location and device from the menus. Then choose one of these options:
If a device is offline, then "[offline]" will be displayed next to the device name. The default status is online.
For more information about which metadata option to choose, see the appropriate section below.
Create Metadata Using SmartThings Capabilities of the Device
Choose this option if your device already supports existing SmartThings capabilities and can therefore use BHS' general purpose graph metadata. Many SmartThings devices (switches, bulbs, thermostats, plugs, etc.) and SmartThings-compatible third party devices support SmartThings capabilities.
If the SmartThings device you select supports existing SmartThings capabilities, you will be able to select Create metadata using SmartThings capabilities of the device. If the SmartThings device you select doesn't support existing SmartThings capabilities, this option will be disabled.
To learn more about existing SmartThings capabilities, see the list of standard SmartThings capabilities.
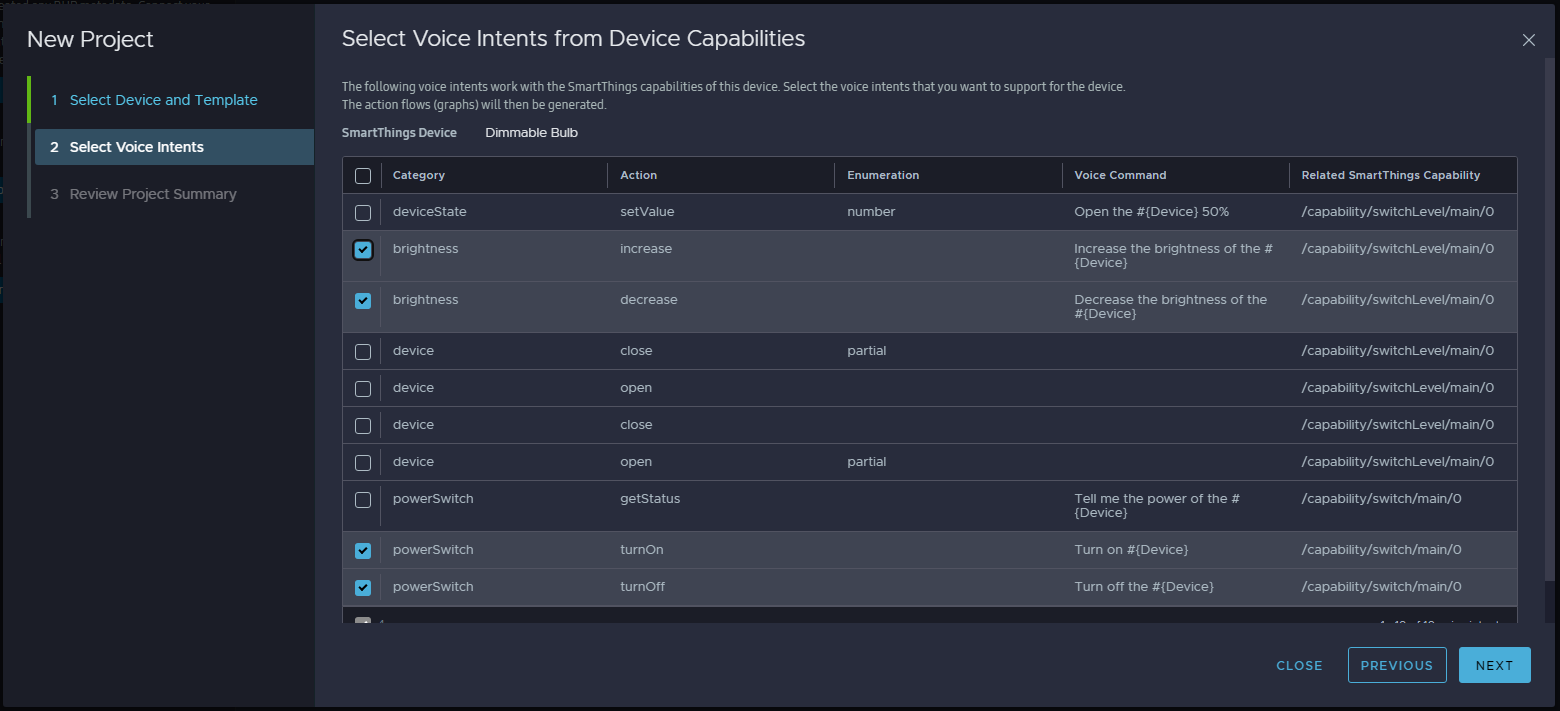
Click NEXT. Now you're prompted to select voice intents from the selected device's existing capabilities. Voice intents are a set of user's intentions that Bixby can understand from natural voice commands. Different capabilities support various voice intents. Select voice intents.
For more information on voice intents, read the voice intents reference page.
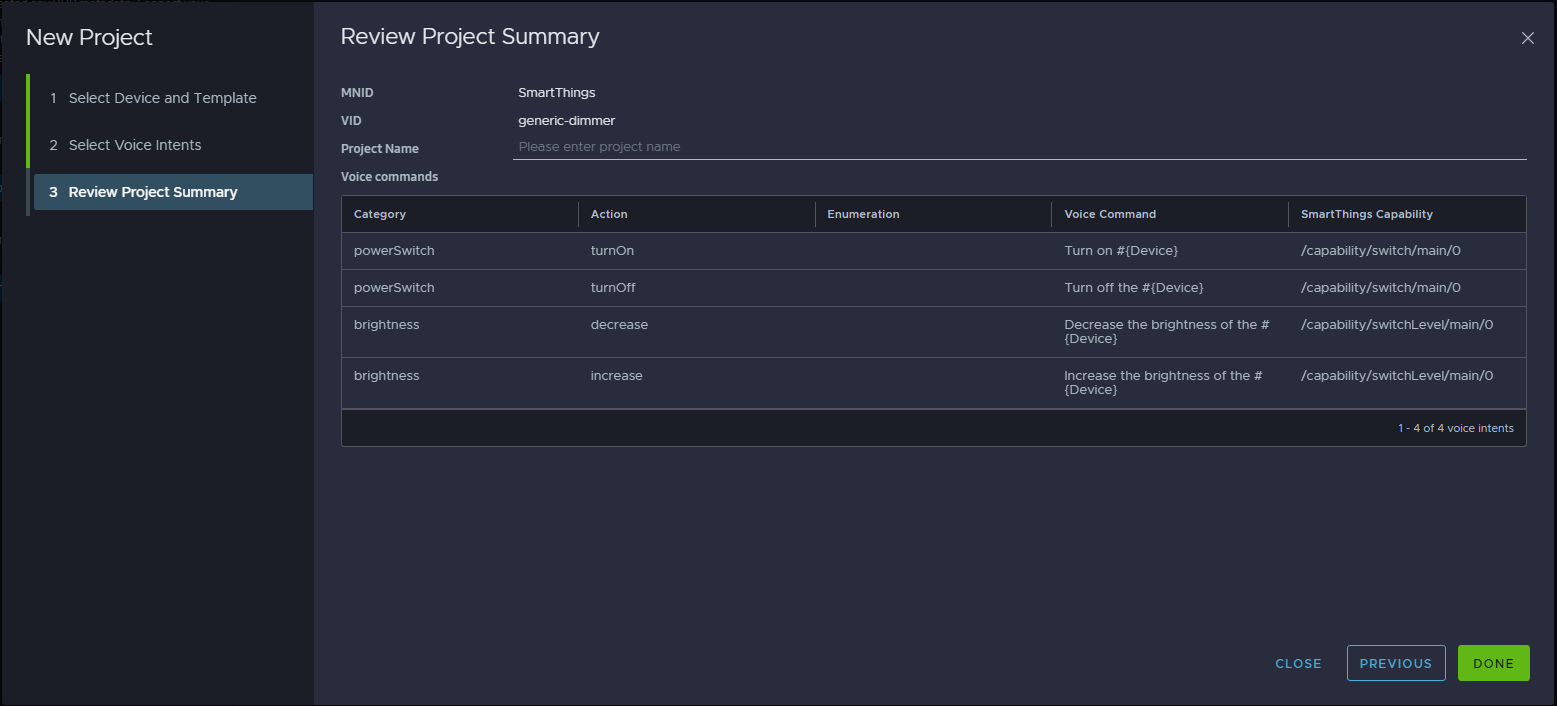
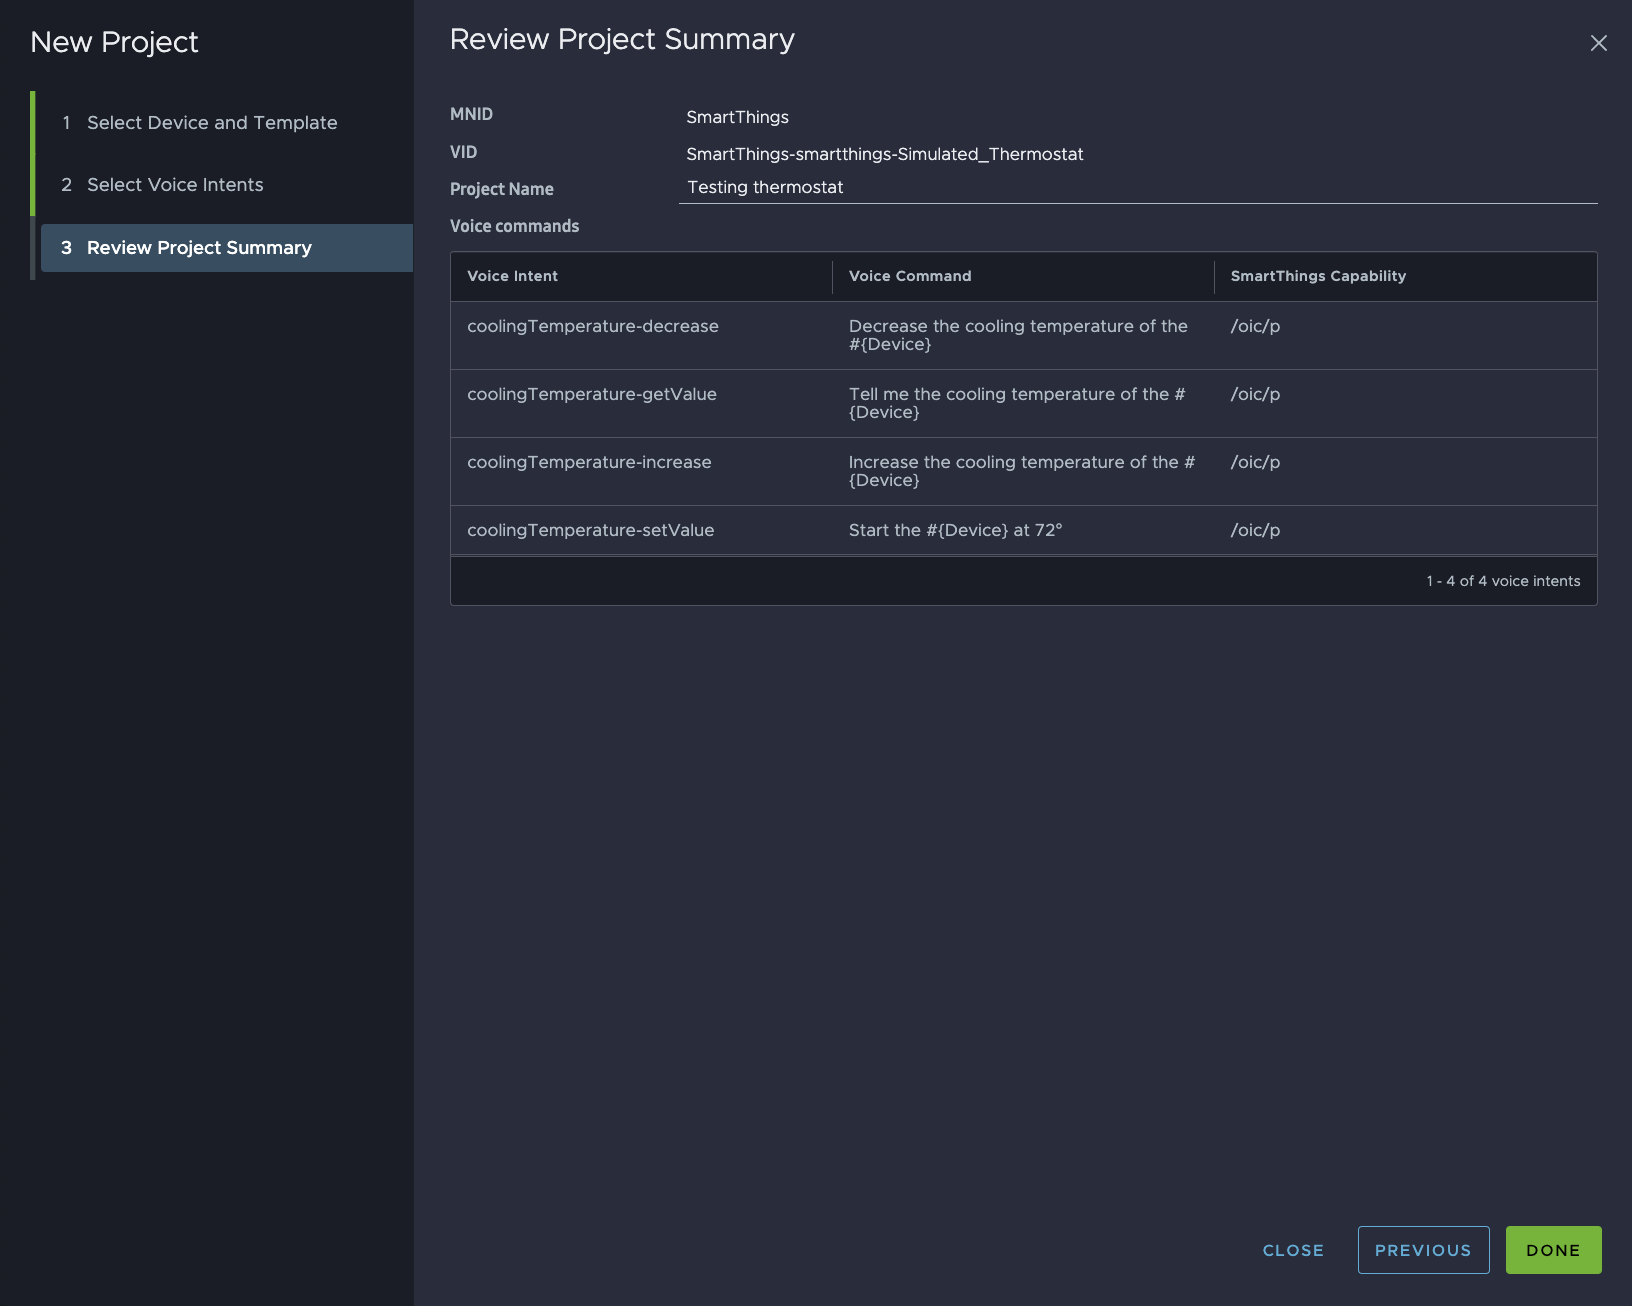
Click NEXT. Add the project name and click DONE.
Create Metadata From Scratch
Choose this option if you want to create all of your own metadata. If the SmartThings device you select doesn't support existing SmartThings capabilities and you're not planning to work on an existing metadata file, you should select this option. If your SmartThings device doesn't support existing SmartThings capabilities, you can create metadata from scratch by using different capabilities, which utilize protocols that are different from those of SmartThings capabilities, to create your BHS graph.
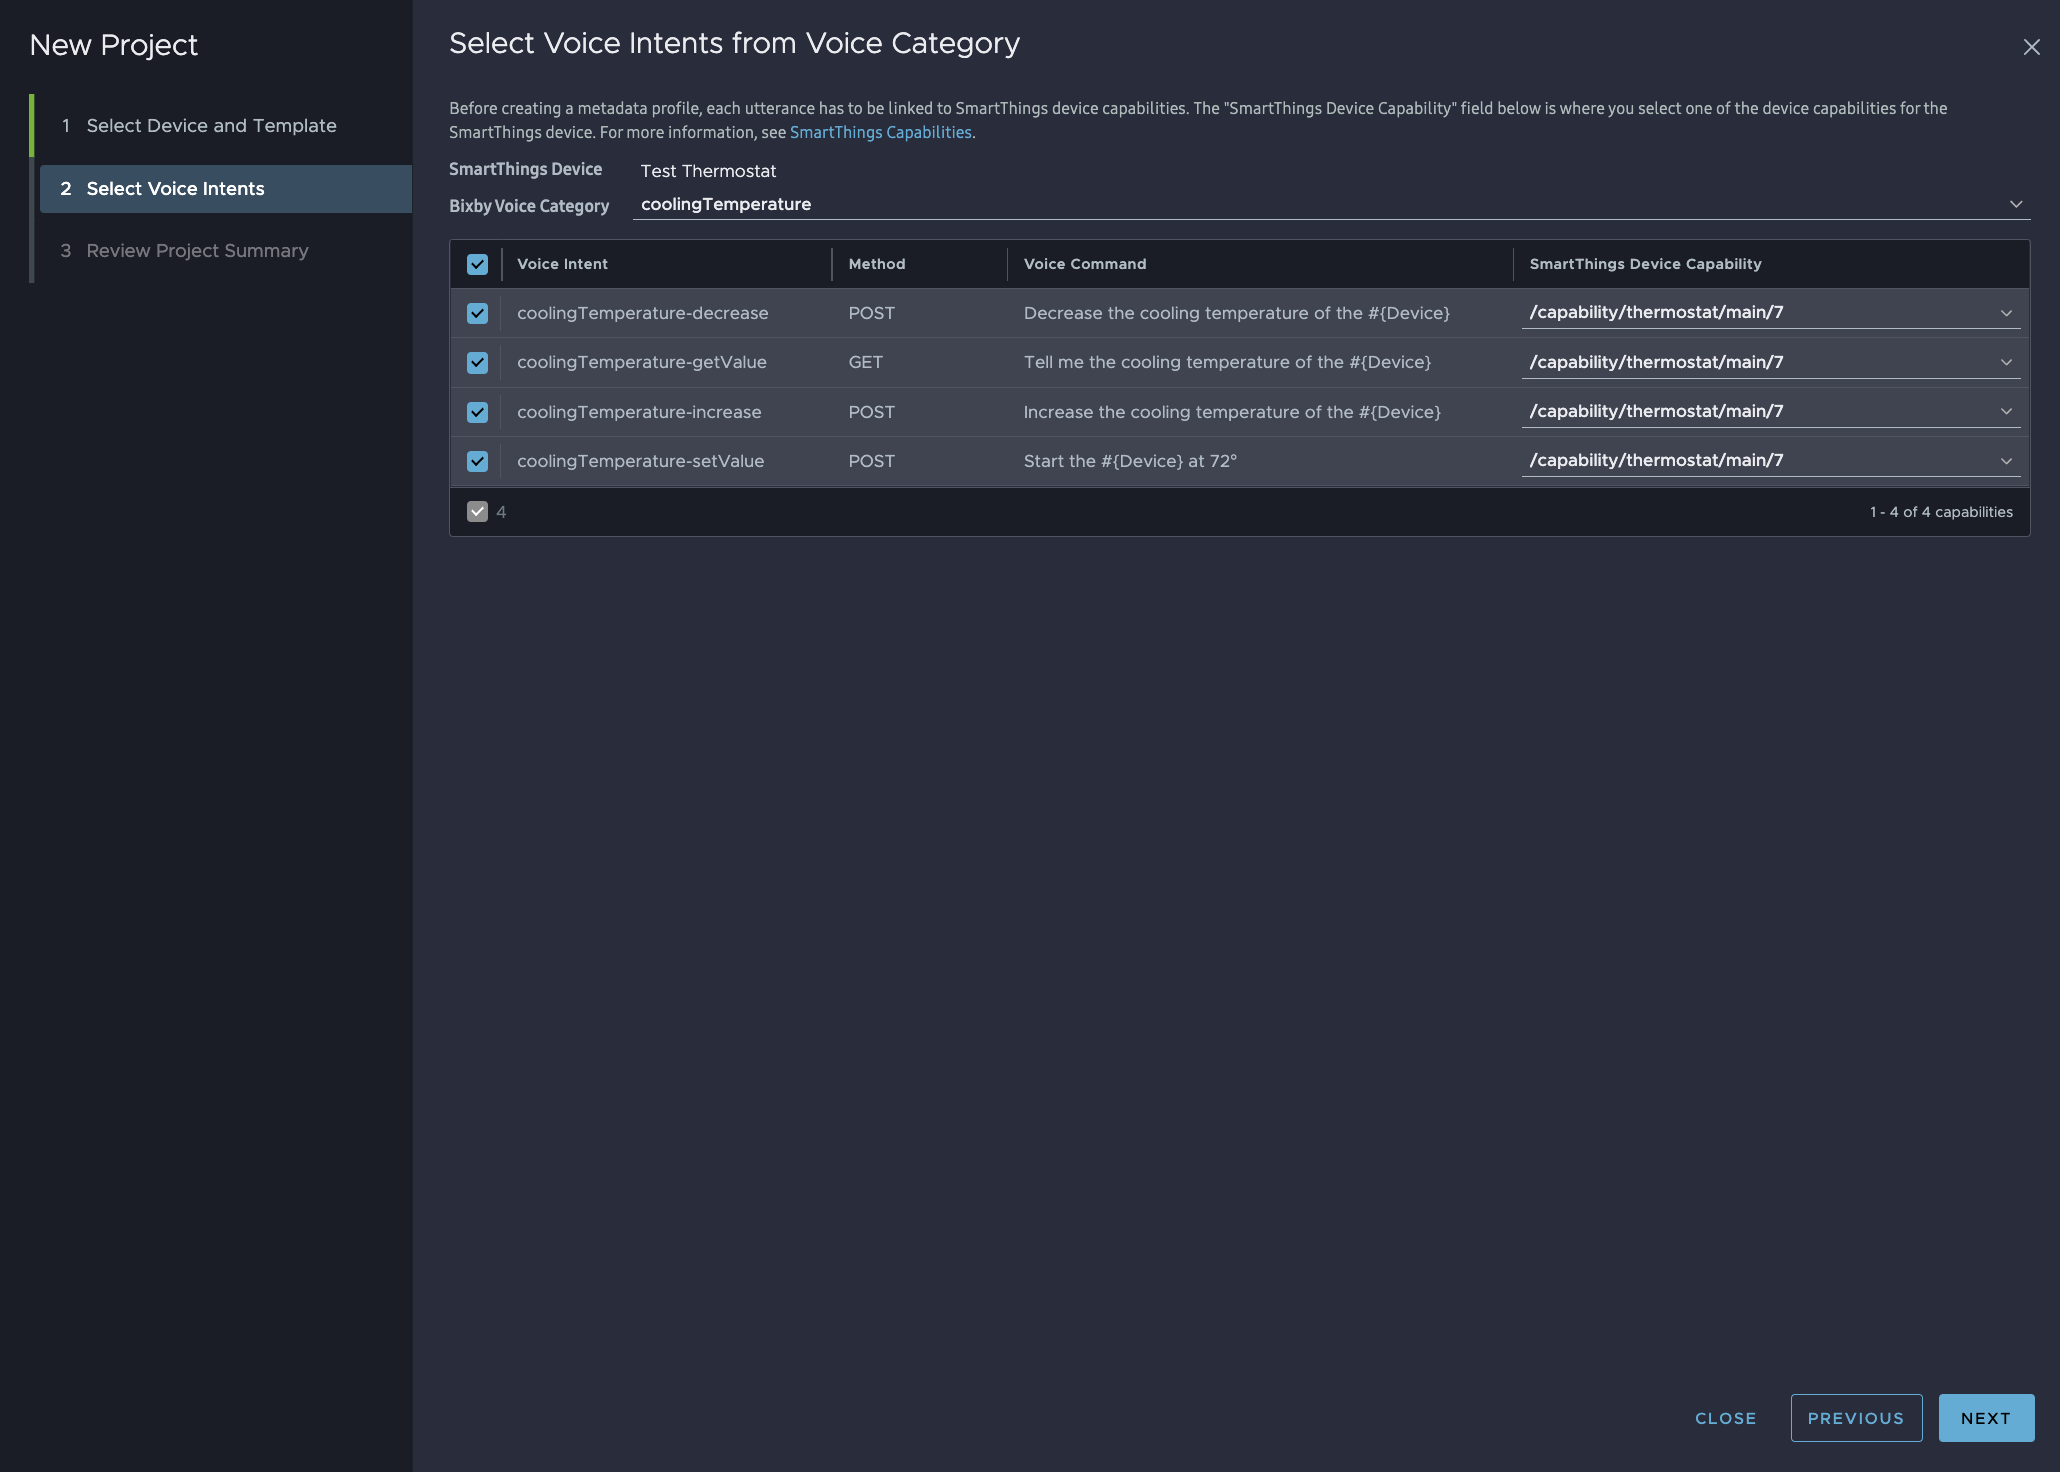
Click NEXT. Now you're prompted to select voice intents supported by a specific Bixby Voice Category. Select a Bixby Voice Category. Then, select voice intents from the list.
Click NEXT. Add the project name and click DONE.
Update From Existing Metadata
Choose this option if you're working with other people, so you can download an existing metadata file from the server. You can modify the downloaded metadata and publish it to the cloud.
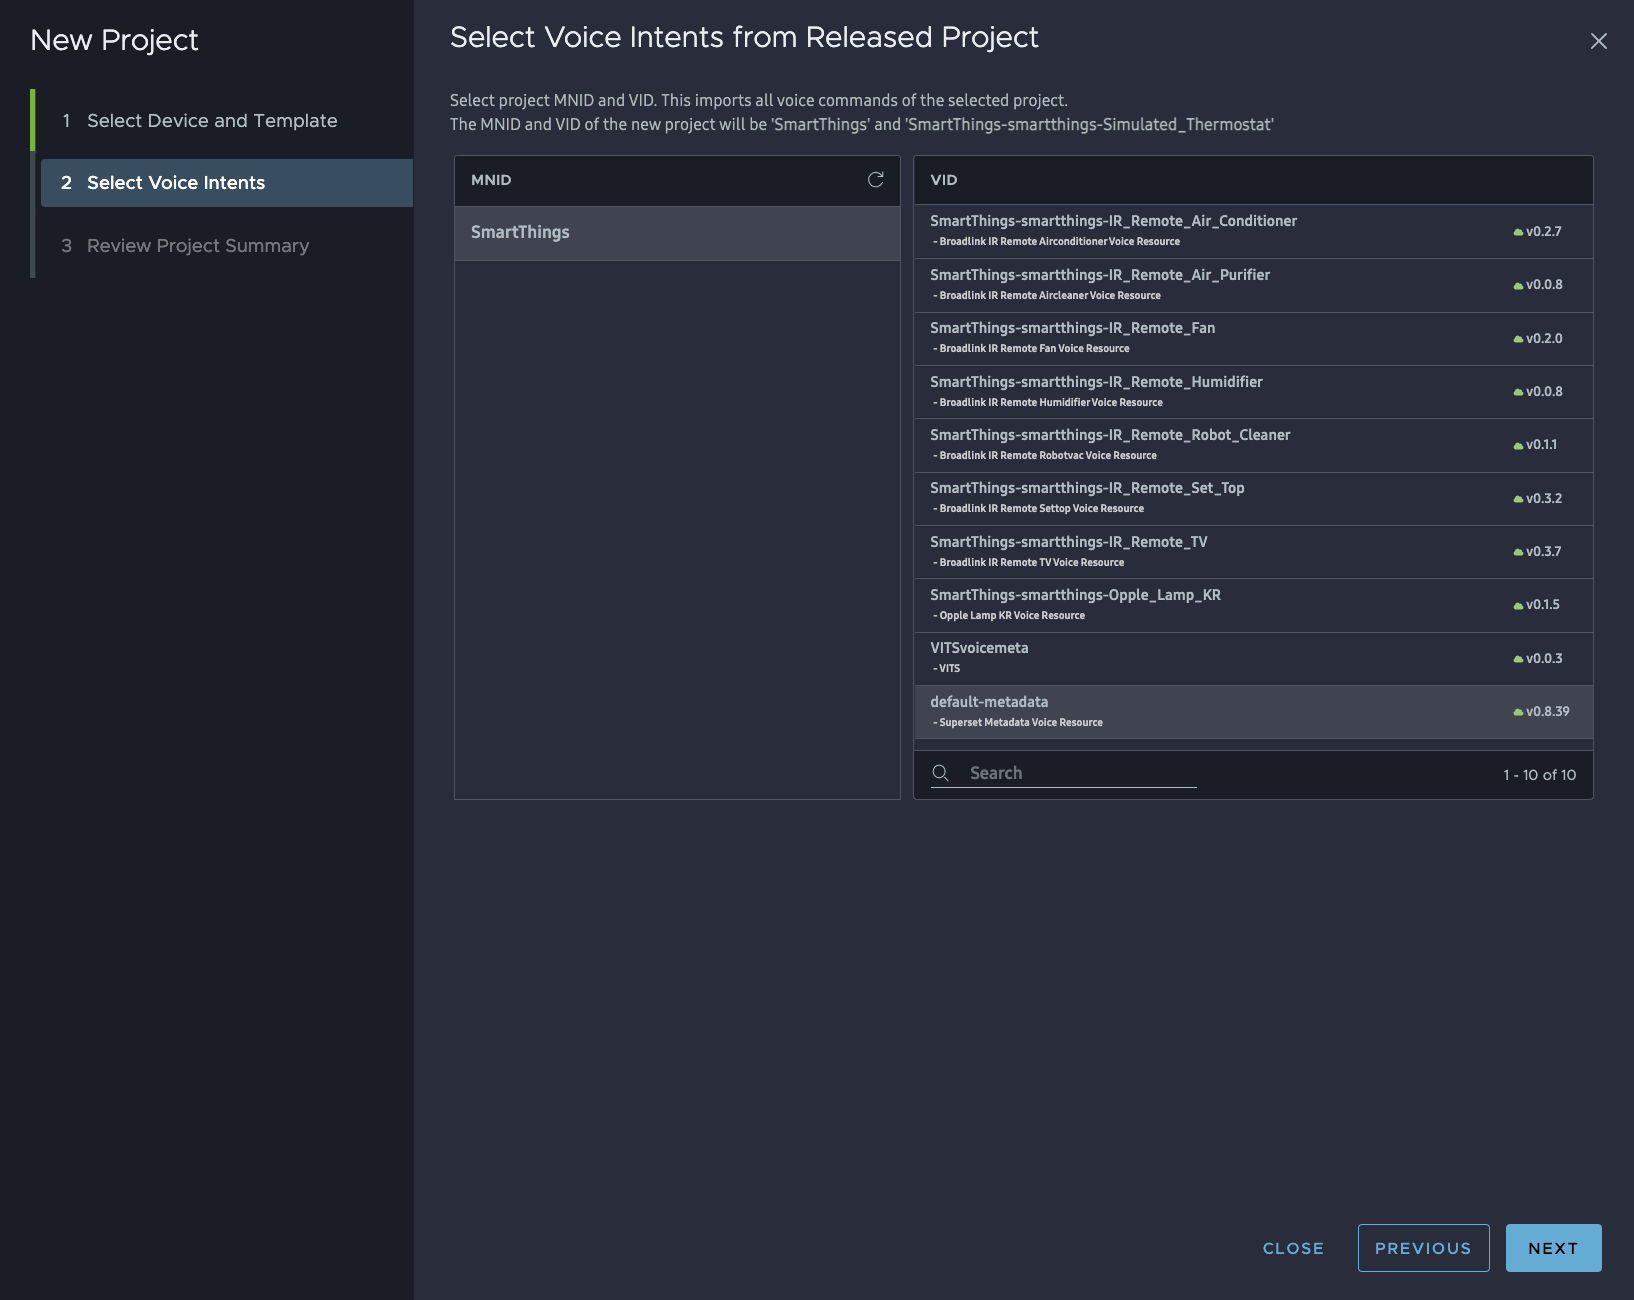
Click NEXT. Now you're prompted to select voice intents from released projects. Select an MNID (the manufacturer ID assigned to developers by SmartThings). Then, select a VID (vendor identifier number assigned to your device) from the list. Click NEXT.
To edit the metadata after the project is created, click the BHP Metadata icon  at the top left corner of the menu bar in the main editor window.
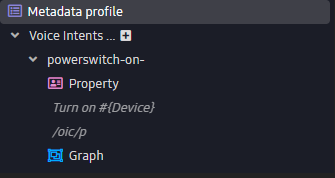
Display Voice Intents
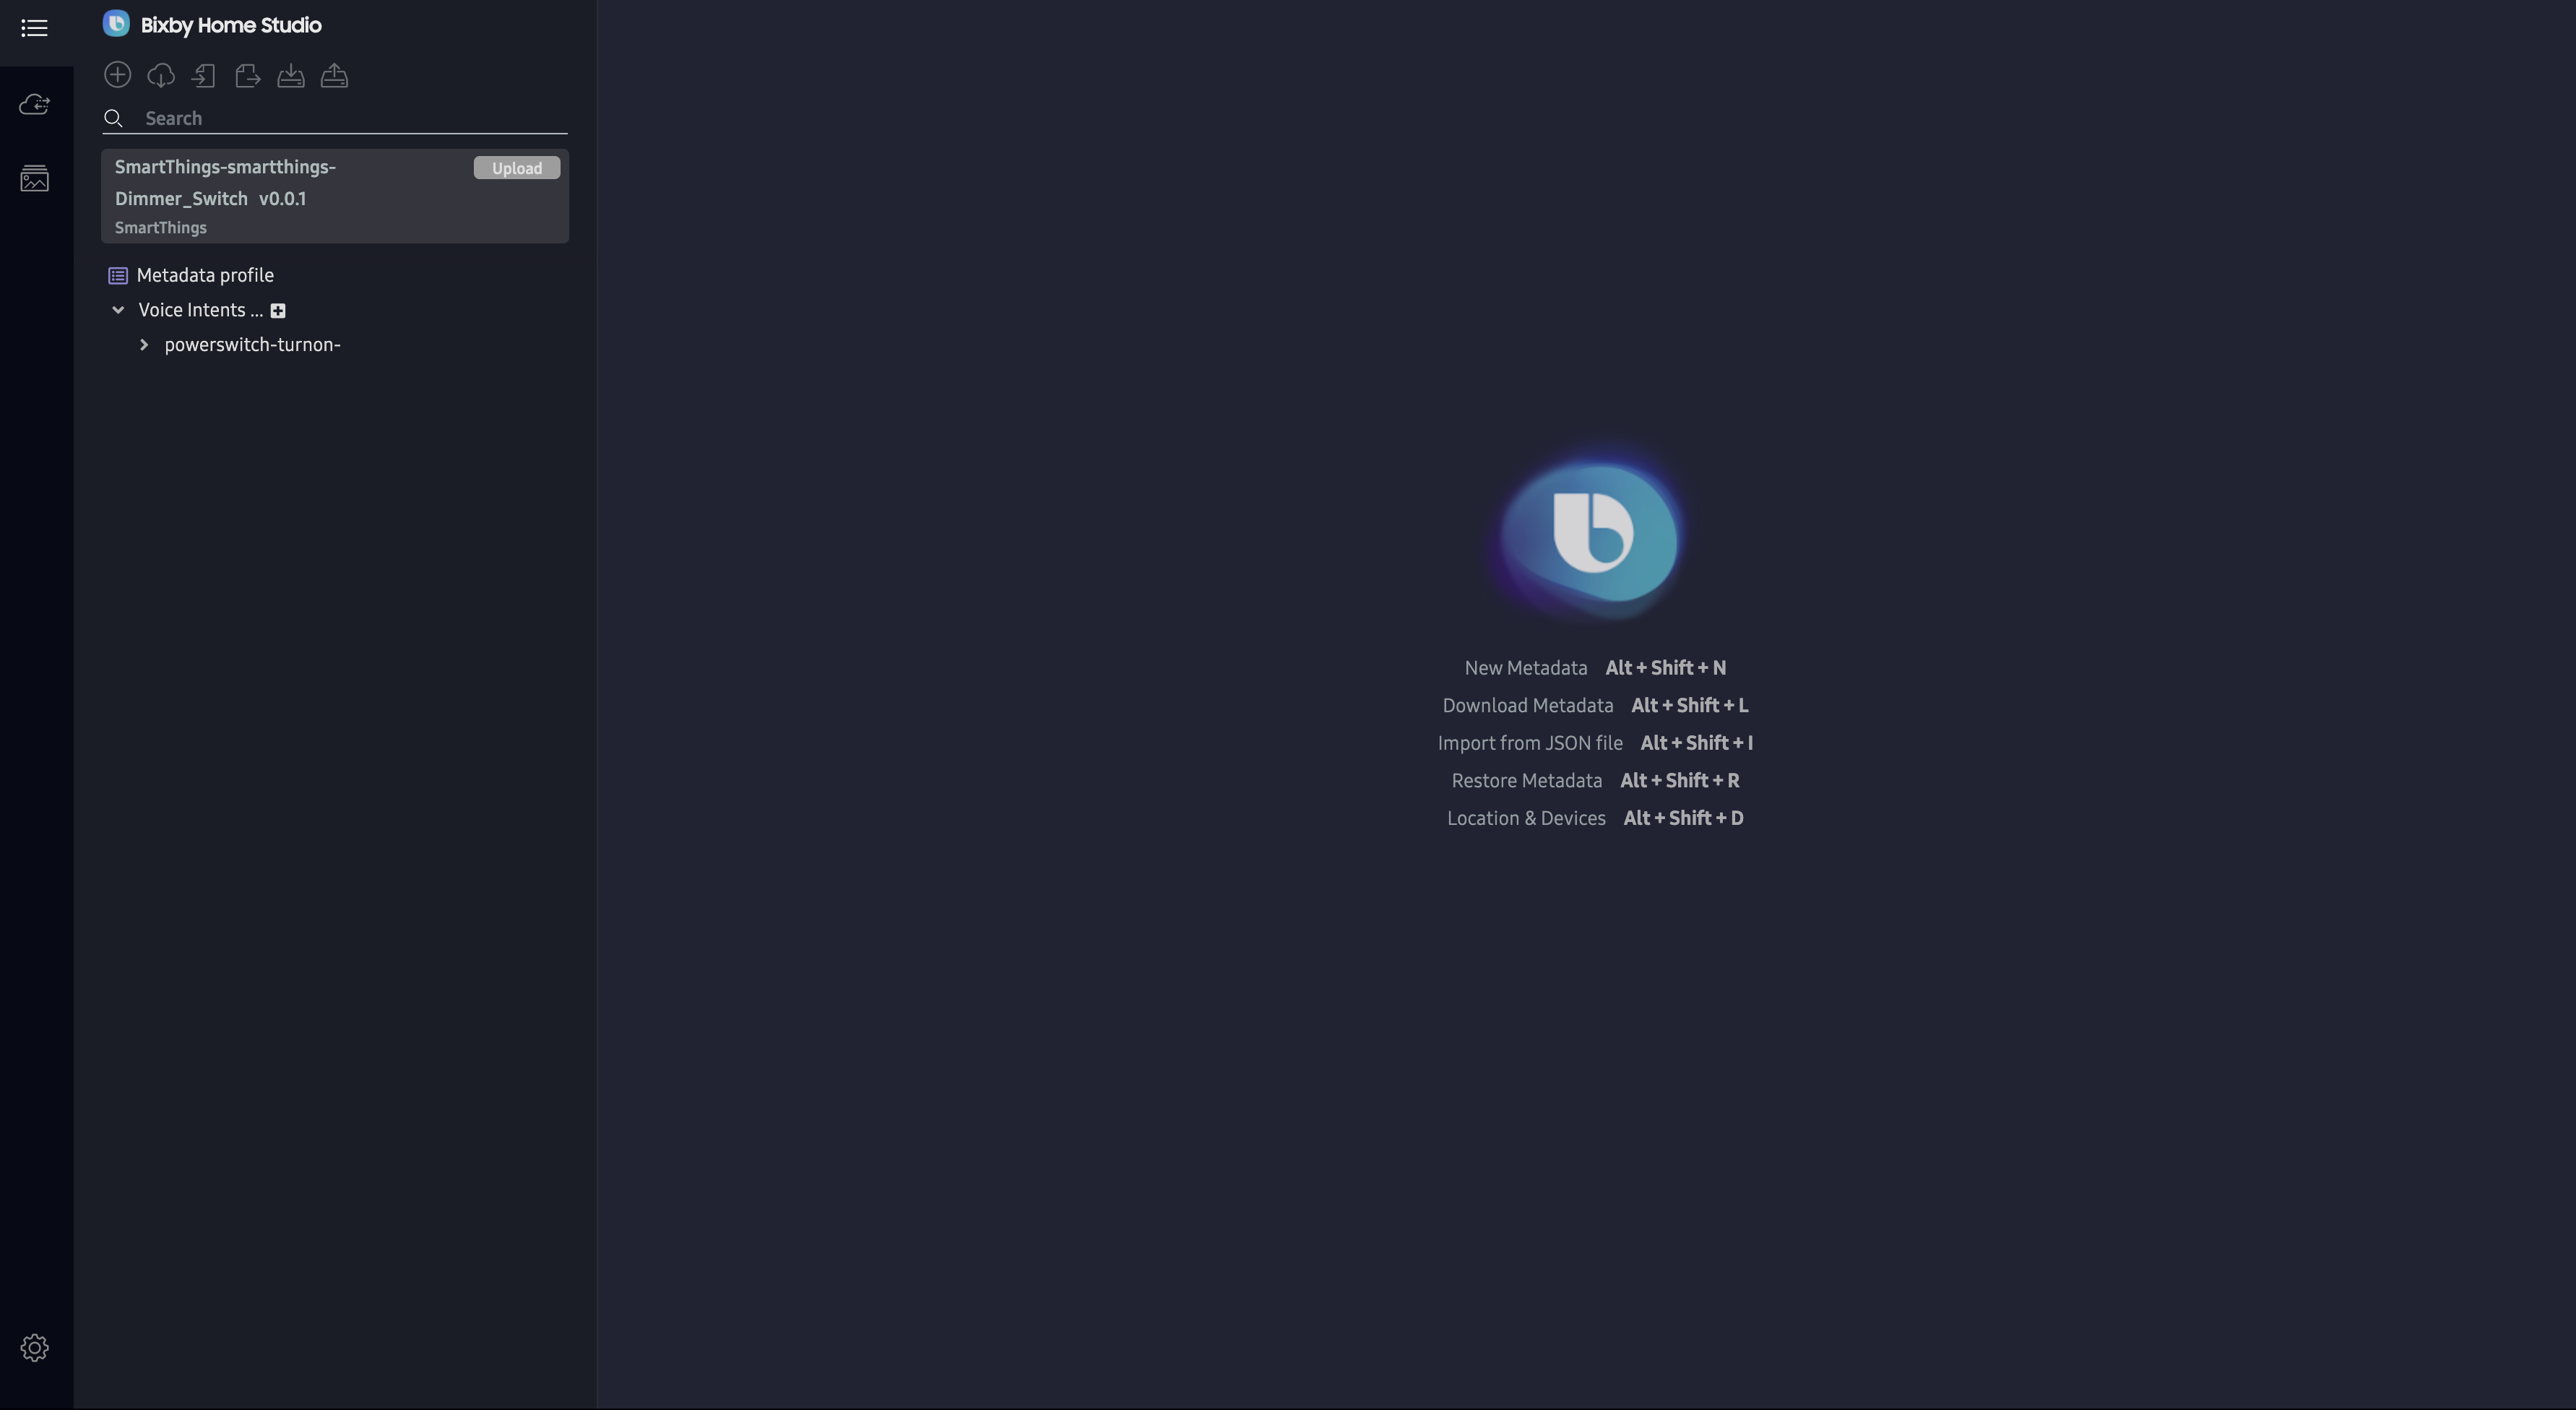
BHS now displays its main editor screen with the voice intents you added or that were included in the existing metadata you selected, displayed in the Voice Intents section of the left sidebar.
Confirm or Edit Device Configuration Information
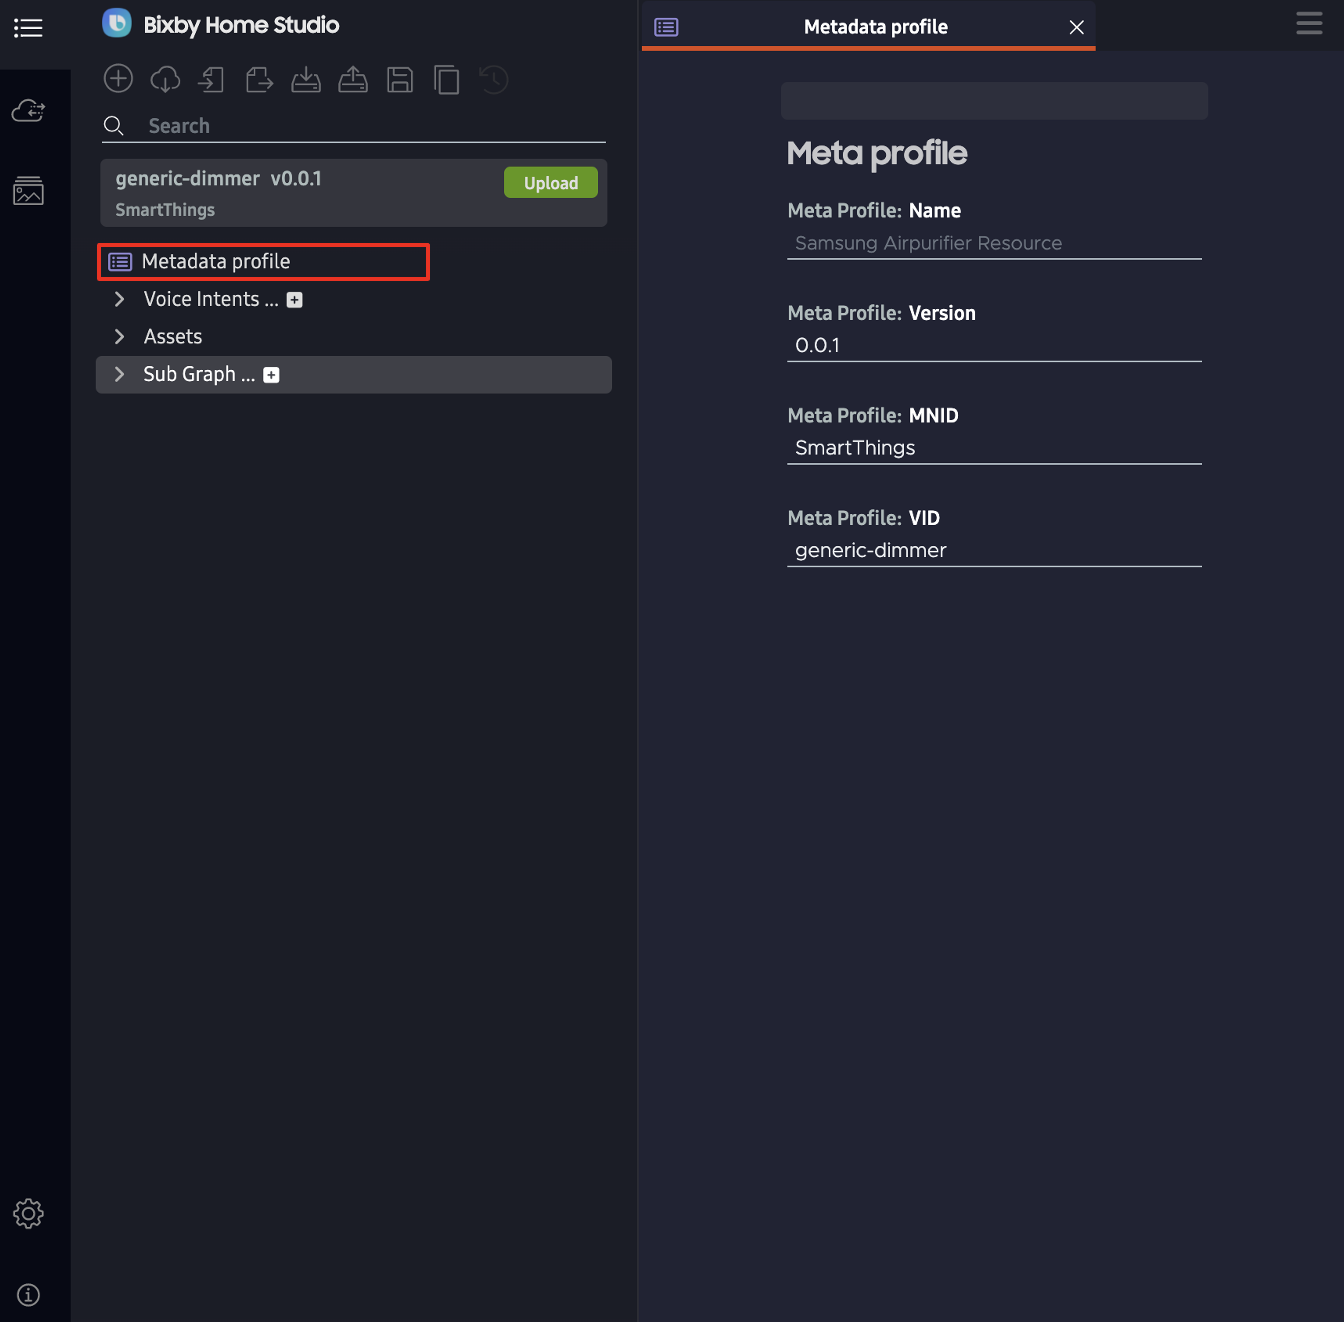
To view or update device configuration information, click Metadata profile in the left sidebar. A new tab opens, which contains the following information:
- Name (of the voice metadata file)
- Version (of the voice metadata file)
- MNID (the manufacturer ID assigned to developers by SmartThings)
- VID (the vendor identifier number assigned to your device)
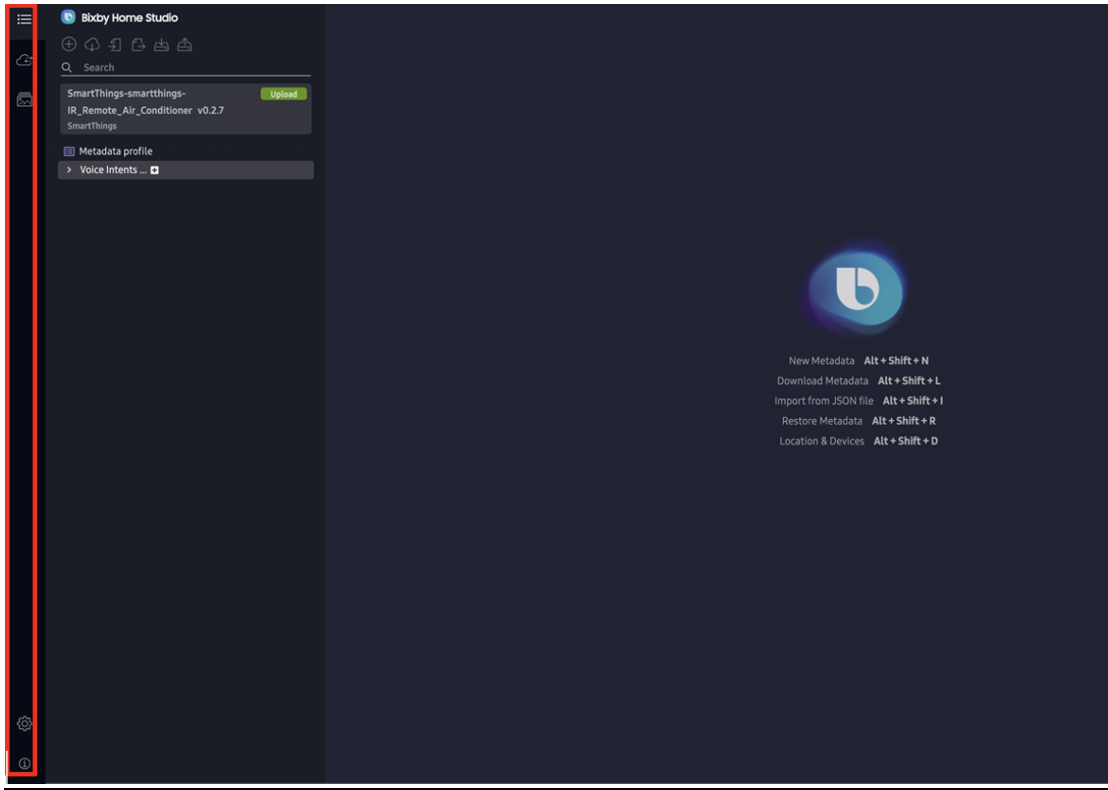
Explore Bixby Home Studio
BHS follows design patterns you'll likely be familiar with if you've used other graphical user interfaces for Internet of Things (IoT) devices: a sidebar on the left and a larger tabbed editor window to the right.
The BHS interface has five main areas:
- Editor: the main area of the window
- Activity Bar: vertical, along the leftmost edge of the metadata sidebar
- Metadata Sidebar: left sidebar, right next to activity bar
- Action Flow Nodes: in a hidden sidebar to the right of metadata sidebar, opens when you click the Graph icon under a voice intent in metadata sidebar
- Status Bar and Console: horizontal, along the the bottom of the window
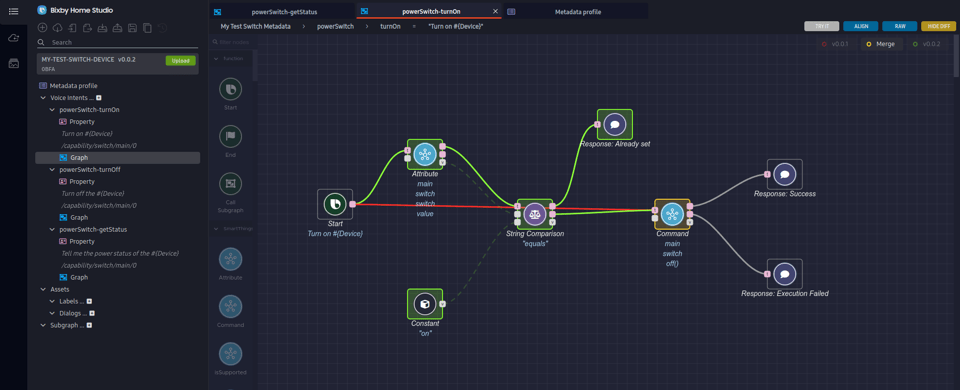
Editor
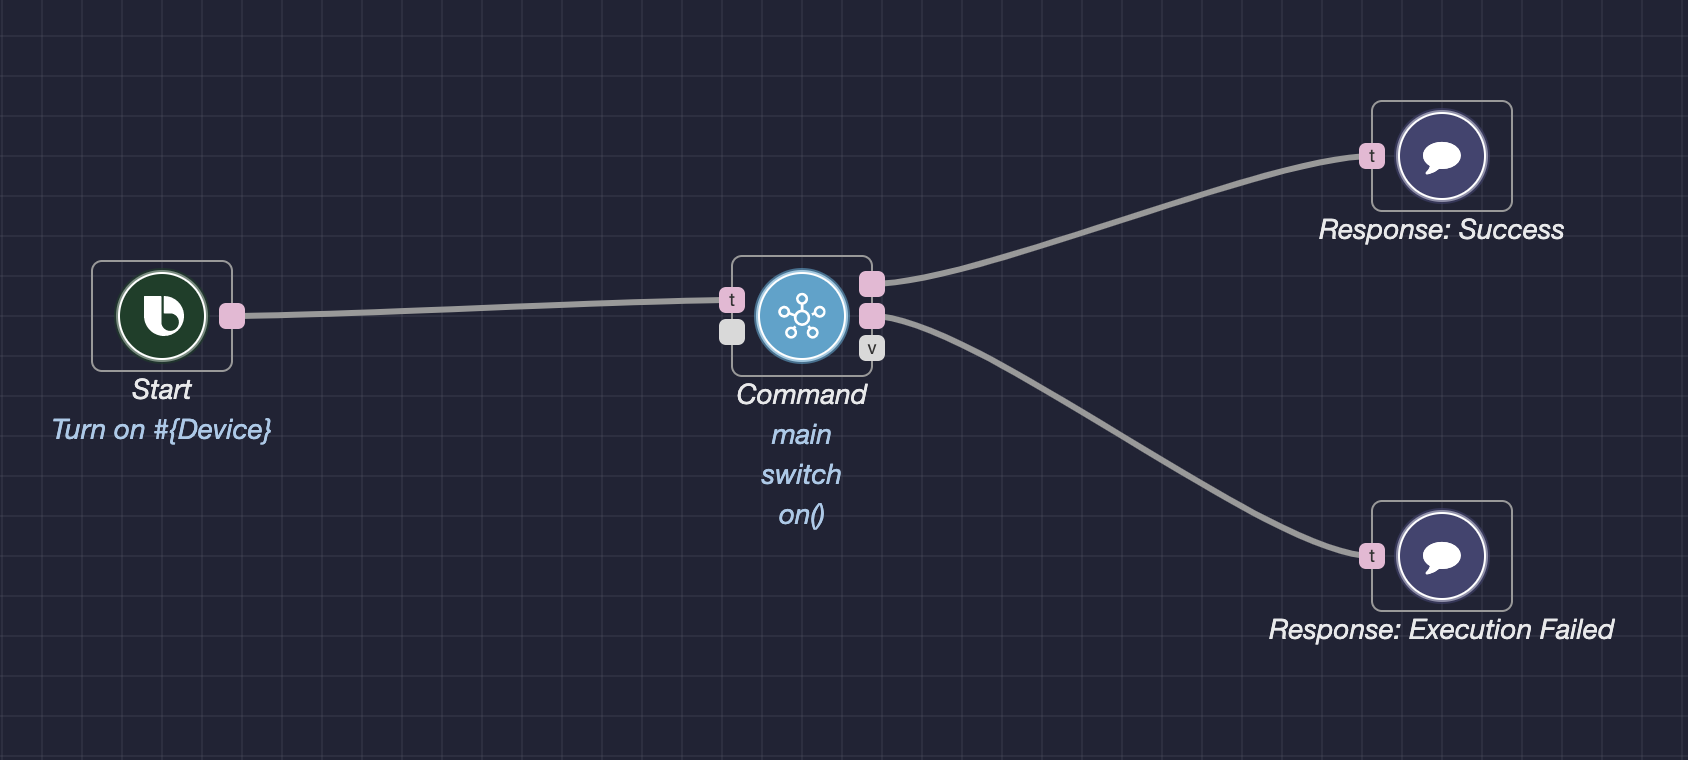
In the editor, you can create action flows, execution graphs that start with a user's spoken command and lead to the appropriate commands to send to the smart device. To create logical action flows to export to your device, you simply drag and drop nodes in the editor. It has a grid background to help you organize your flows. Also, you can easily move nodes around and connect them to each other. You can also select a group of nodes by dragging a highlight box around them, in order to move, delete, or copy them.
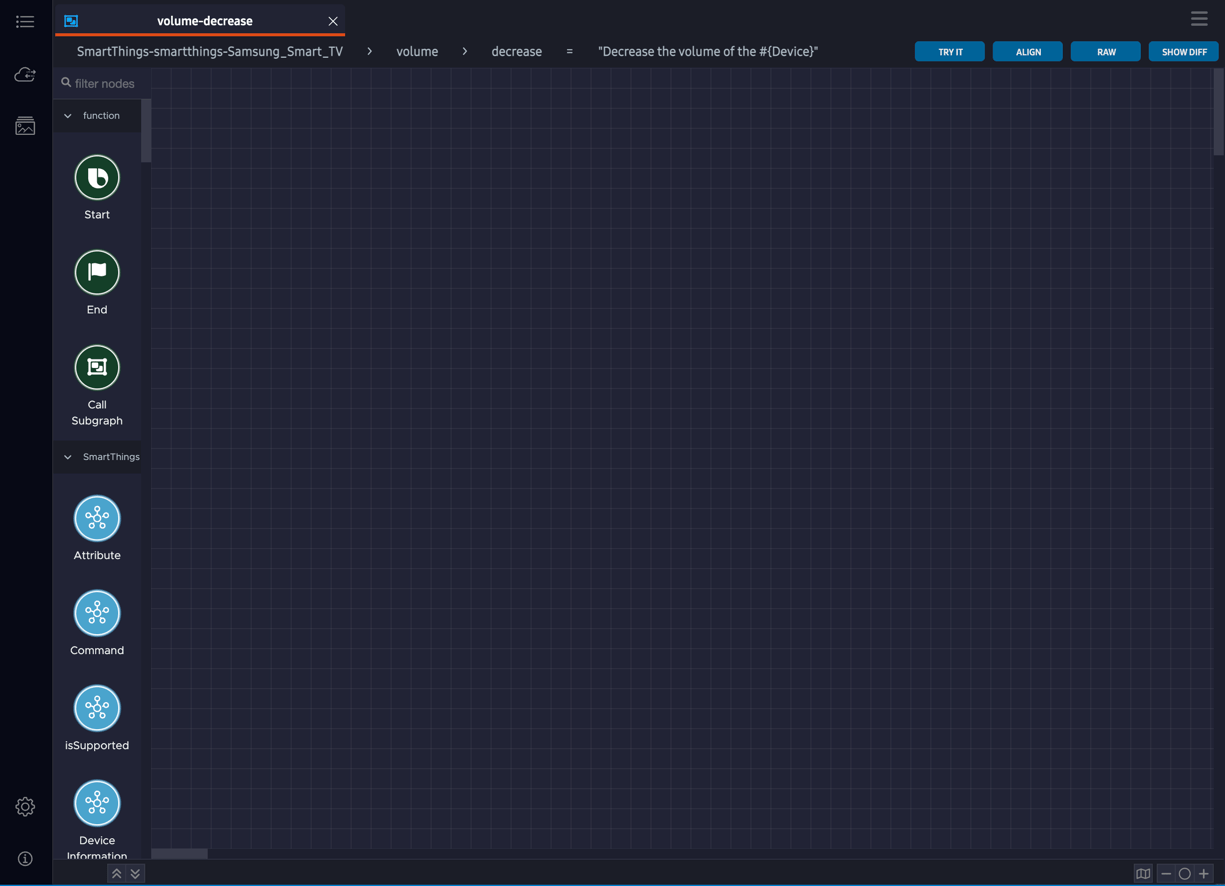
At the top right of the editor, there are four action buttons:
- Try It: test an action flow
- Align: align the current graph
- Raw: display the graph as raw JSON data
- Show Diff: show differences between the current graph and the latest deployed version
Activity Bar
BHS' left margin displays five icons, three at the top and two at the bottom. These activity bar icons switch between various tasks used in action flow development.
In order from top to bottom:
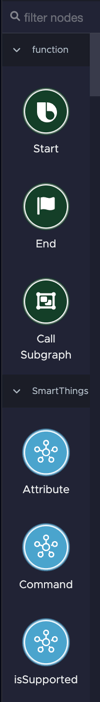
Action Flow Nodes
You can drag these nodes into the home editor window to create the action flow graph. Each node performs a specific action. An action flow contains different types of nodes connected by execution and data paths. By associating a voice intent with an action flow, you specify the behavior the device should exhibit for that voice intent.
Nodes are the functions that developers can use in BHS. A node consists of the following components:
- Configuration: This describes how the node is set up.
- Data input/output ports: These ports transfer information into and out of the node. For more information, see the Data Types reference page.
- Triggering ports: These are where the node receives or sends the execution flow.
To help you better keep track of what various nodes or groups of nodes do, you can add inline node comments or add comments to a group of nodes.
The action flow nodes are grouped by category:
- Function: These include nodes that start or end an action flow.
- SmartThings: These nodes can get information about the SmartThings device's specified capability attribute or execute a specified capability command of the device.
- Value: These nodes allow you to operate on values like store, read, define constants, map values, etc.
- Utterance: These nodes can perform various functions related to user utterances.
- Comparison: These nodes compare numerical and string values for various objectives.
- JSON: These nodes allow you to perform various actions related to JSON data.
- Mode: These nodes return attributes and lists of labels that are mapped to the node's relevant input ports.
- Common response: These nodes send the user default dialogue for various situations.
- Duration utility: These nodes can convert numbers and strings to amounts of time or convert time values to formatted strings.
- Flow control: These nodes perform logical operations on boolean values, control triggers according to boolean values, and route triggers based on input values.
- String utility: These nodes allow you to perform various actions related to strings, such as converting input values to strings and getting substrings.
- Utility: These nodes can perform actions such as returning a UTC timestamp, generating random strings, concatenating values, and counting elements in a collection.
- Math: These nodes enable mathematical actions, such as computing sums, calculating remainders, and rounding to the nearest integers.
Add Inline Node Comments
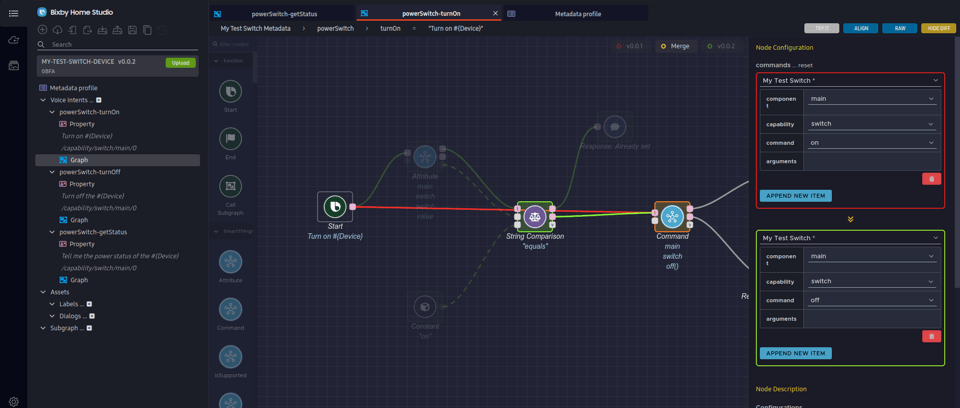
You can also add inline comments to nodes. Sample graphs use node comments to help make execution flows easier to understand by explaining the process node by node. You can also use node comments on a single node within a graph to show useful information, such as what a node is supposed to do or what information is supposed to be returned. This graph shows inline node comments that help explain the execution flow:
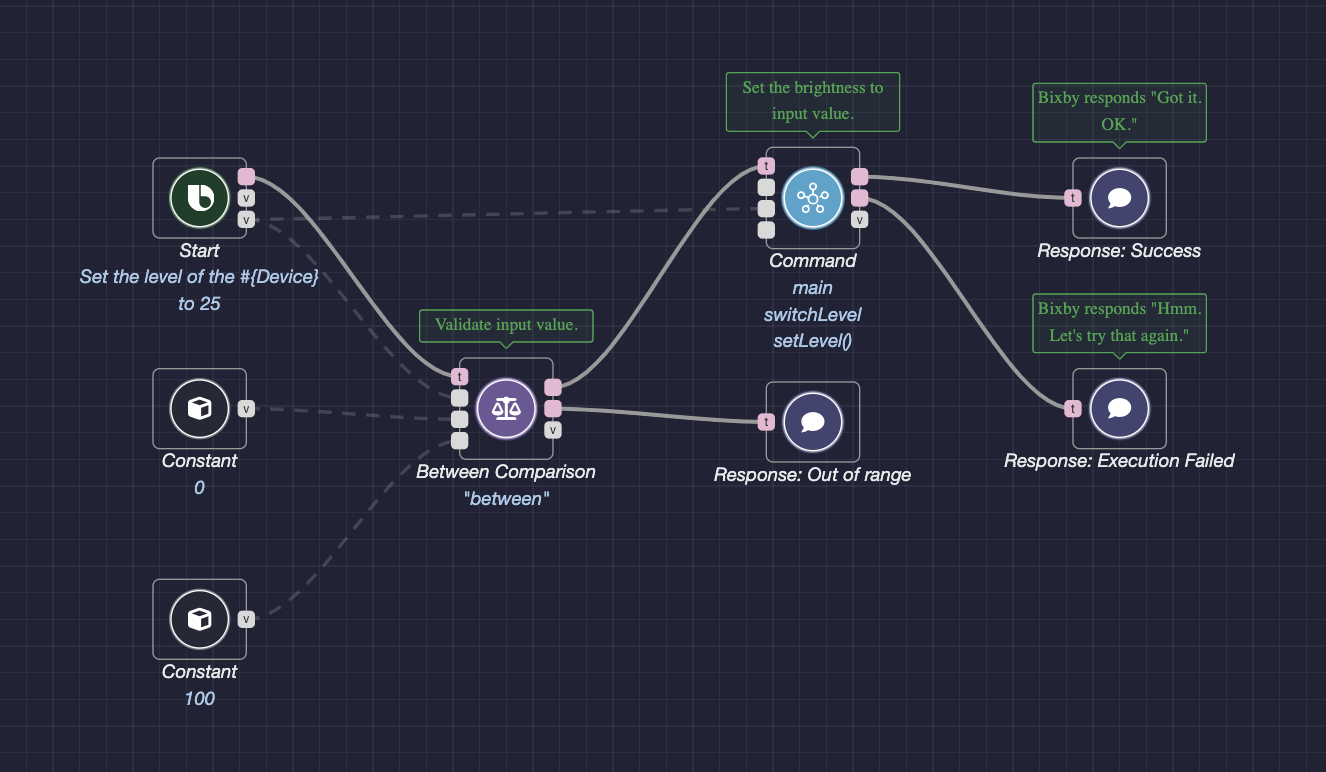
To add comments, right-click a node and enter a comment in the pop-up window on the Comment line. To make comments visible, click the box next to Show Comment.
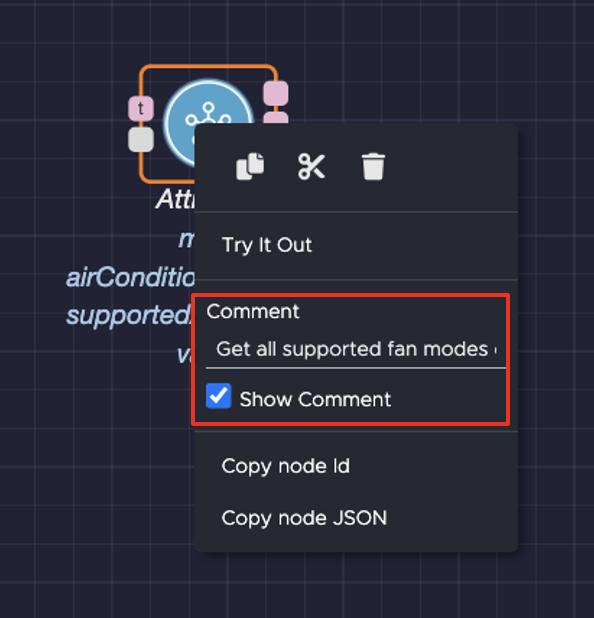
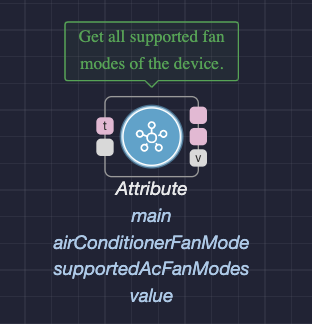
In this example, the Attribute node fetches all the supported fan modes for the air conditioner. This makes it easier to more quickly know what information the node is getting from the device.
The inline comment becomes visible in green, in a green-outlined box above the node.
To add a comment to a group of nodes, use the Comment Group feature.
To learn more about the various types of nodes, see the Nodes Reference Page.
Add Comments to a Group of Nodes
You can also add comments to a group of nodes using the Comment Group feature. With this feature, you can add useful information, such as what a group of nodes is supposed to do and what actions take place in a particular section of the graph.
A Group is the set of nodes in a Comment Group. A Comment Group consists of a group, its Group Comment, and the highlight box surrounding it. The Group Comment is the comment itself.
The Comment Group feature allows you to do the following:
- Add a Comment Group
- Add a Node to a Comment Group
- Remove a Node from a Comment Group
- Delete a Group Comment
- Edit a Group Comment
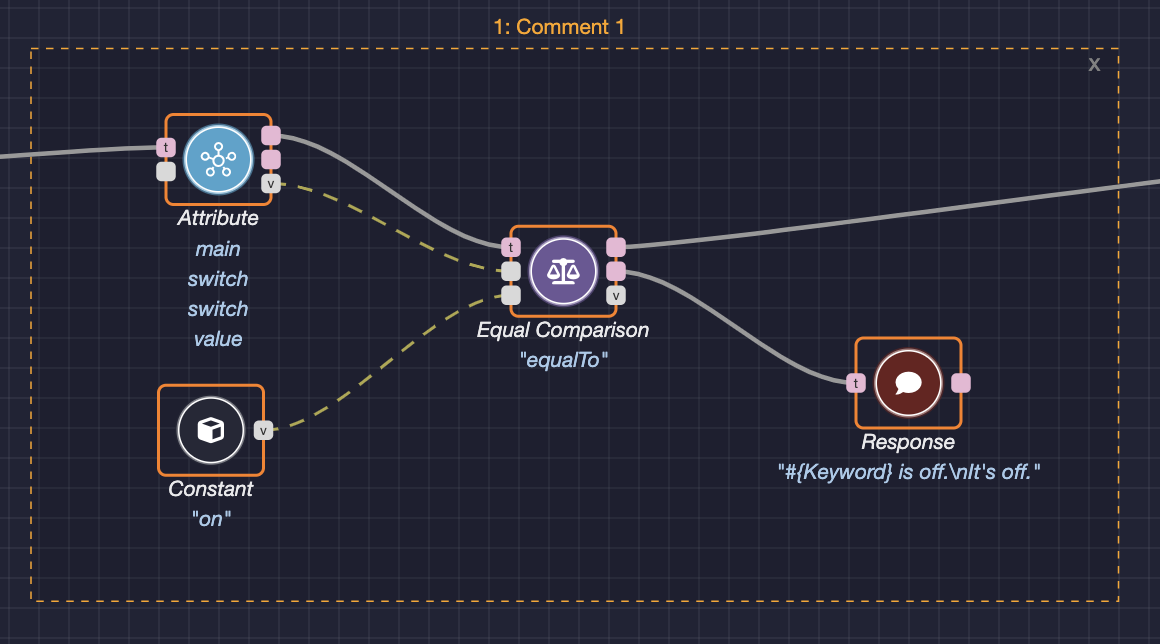
Add a Comment Group
To add a Comment Group:
- Select a Group by dragging a highlight box around the nodes you want to include in the Comment Group.
- Right-click any of the selected nodes. The pop-up appears where you can add the comment.
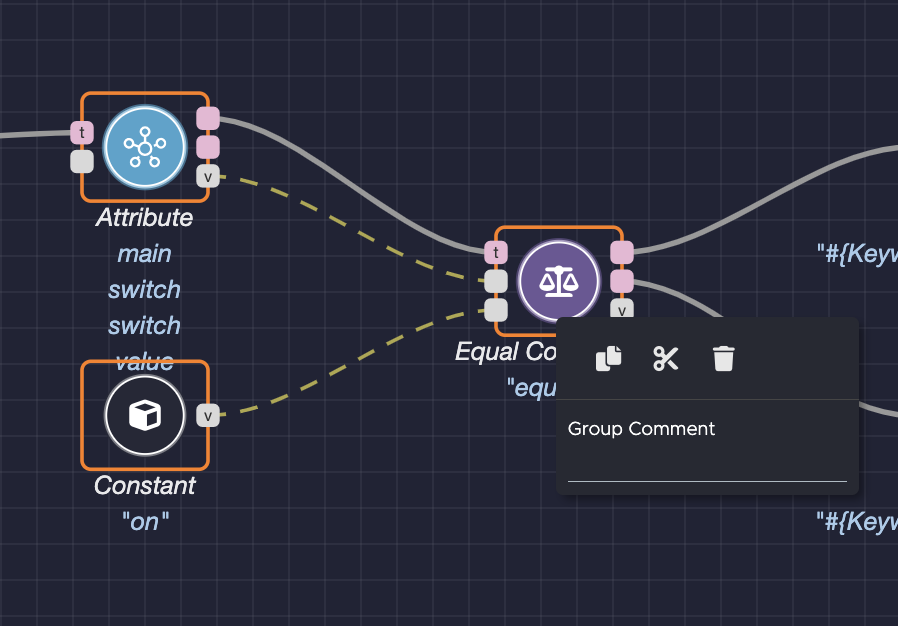
- Add a comment on the Group Comment line.
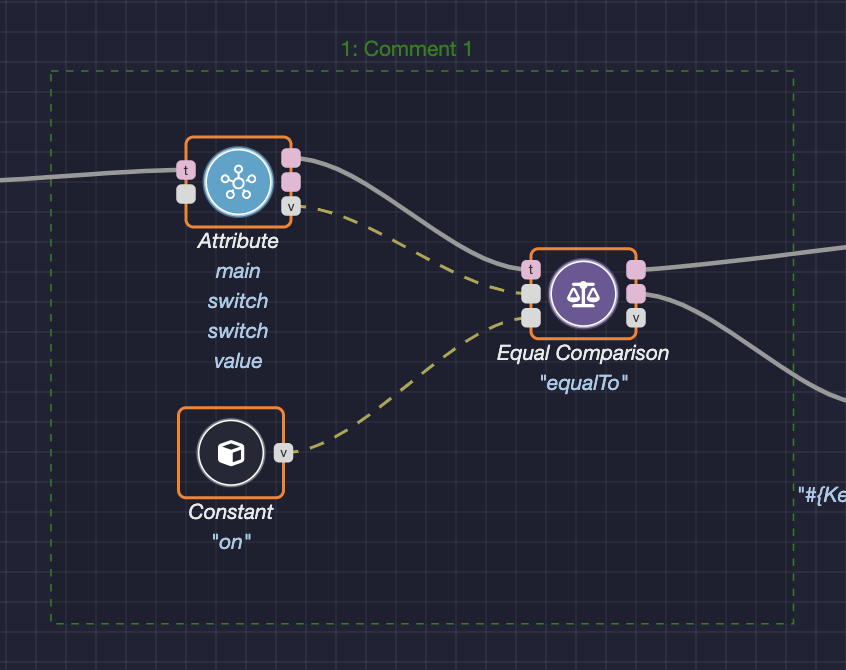
- Press Enter on your keyboard. A green dashed highlight box appears around the Group. The number of the Comment Group and the Group Comment are listed above the box.
Add a Node to a Comment Group
To add a node to a Comment Group:
- Press Control while selecting a Comment Group and a node you want to add to it. The Comment Group's dashed highlight box turns orange, with each node within the Group highlighted in a solid orange box.
- Right-click the node you want to add to the Group. The pop-up appears where you can add the node to the Group.
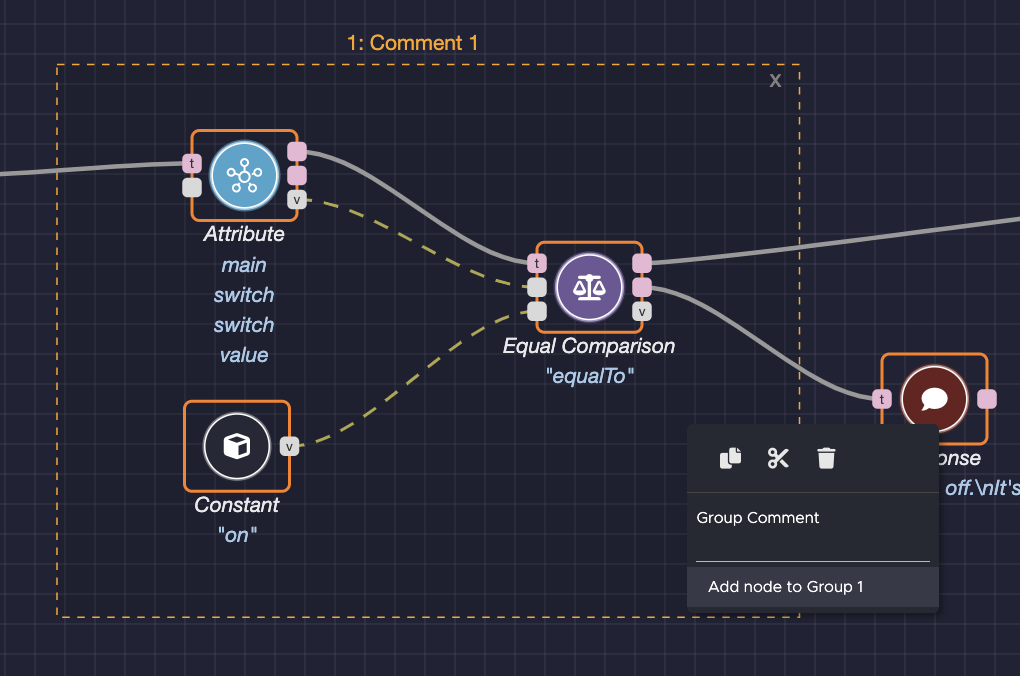
- Click add node to Group '%Comment Group Number%'. The highlight box now includes the newly-added node, which also has a solid orange box around it.
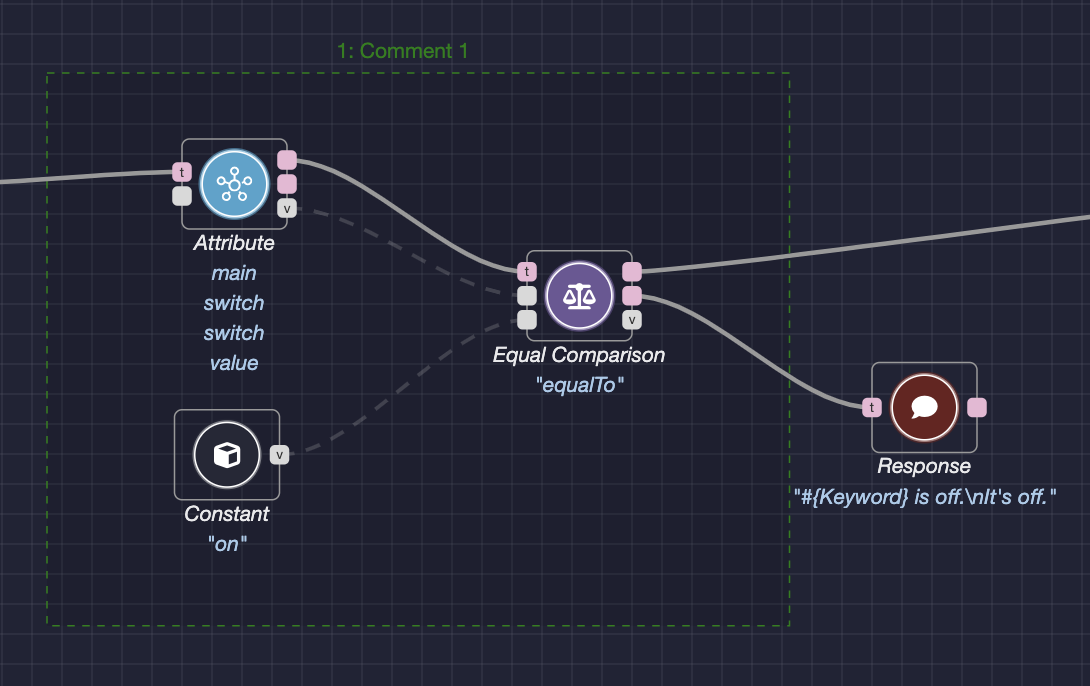
Remove a Node From a Comment Group
To remove a node from a Comment Group:
Right-click the node you want to remove from within the green-dashed Comment Group highlight box. If the highlight box is orange, click anywhere outside the box to turn it back to green. The pop-up appears where you can remove the node.
Click Remove node from Group '%Comment Group Number%'.
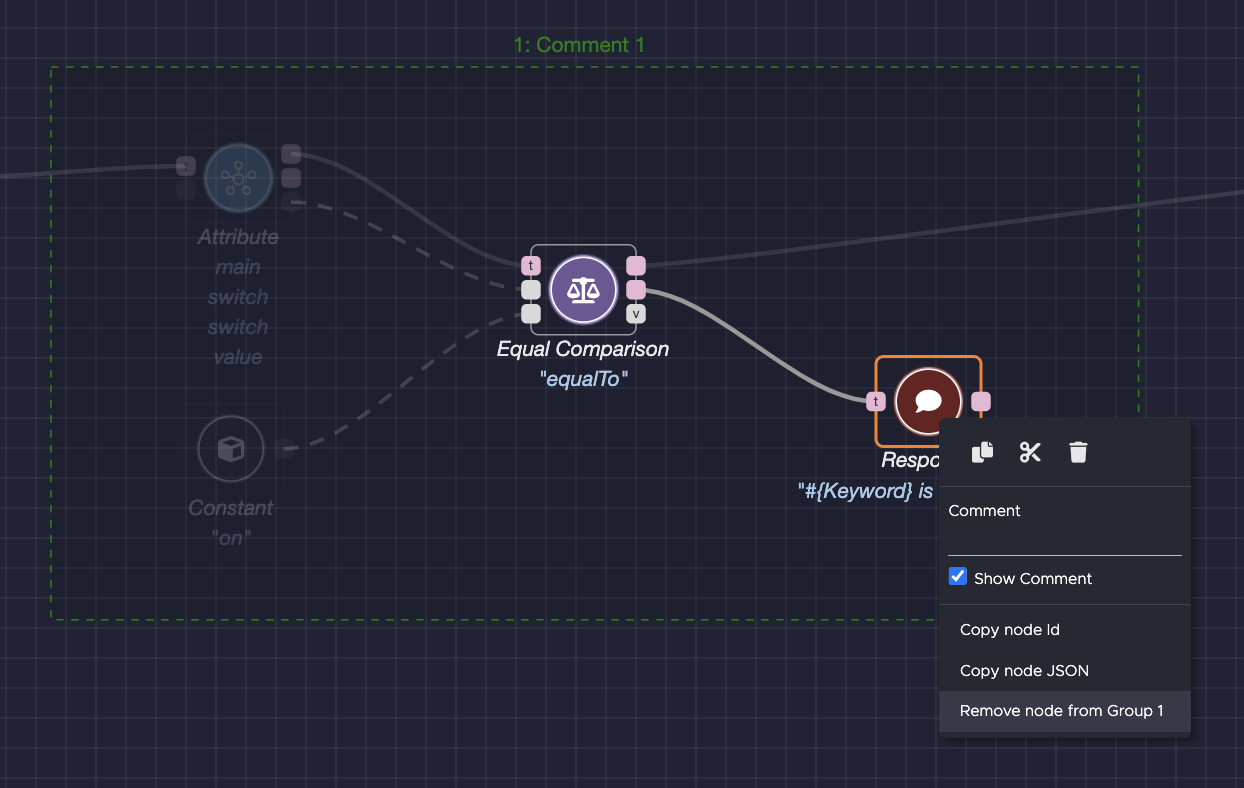
The removed node will no longer be highlighted in a solid orange box when you click the highlight box for the Comment Group. If the removed node also no longer needs to stay within the boundaries of the highlighted box, the box will adjust to exclude the removed node.
Delete a Group Comment
To delete a group and its comment:
- Select a Comment Group. The Comment Group's dashed highlight box turns orange. You will see an X at the top right corner of the highlight box.
- Click the X. The highlight box and Group Comment disappear.
Edit a Group Comment
To edit a Group Comment:
- Select a Comment Group. The Comment Group's dashed highlight box turns orange, with each node within the Group highlighted in a solid orange box.
- Right-click any node within the Group. The pop-up appears where you can edit the comment.
- Edit the comment on the Group Comment line.
- Press Enter on your keyboard. The edited Group Comment now appears above the highlight box.
Create an Action Flow
By associating a voice intent with an action flow consisting of nodes, you specify what action the device should perform for that voice intent.
The Node Recommendation feature, which allows you to see recommendations for next possible nodes while creating action flows, can help you shape your action flows.
To learn more about action flow nodes and graphs, read the Sending a Device Command guide.
Align Graphs
To streamline your graph, click the Align button at the top right of the editor.
Metadata Sidebar
The metadata sidebar displays the list of voice intents you selected when creating your new metadata project. Buttons at the top of the sidebar allow you to create, add, export, and manage metadata.
- New Metadata
- Load Metadata
- Import Metadata from File
- Export Metadata
- Backup Metadata
- Restore Metadata
- Save
- Save as
- Recent files
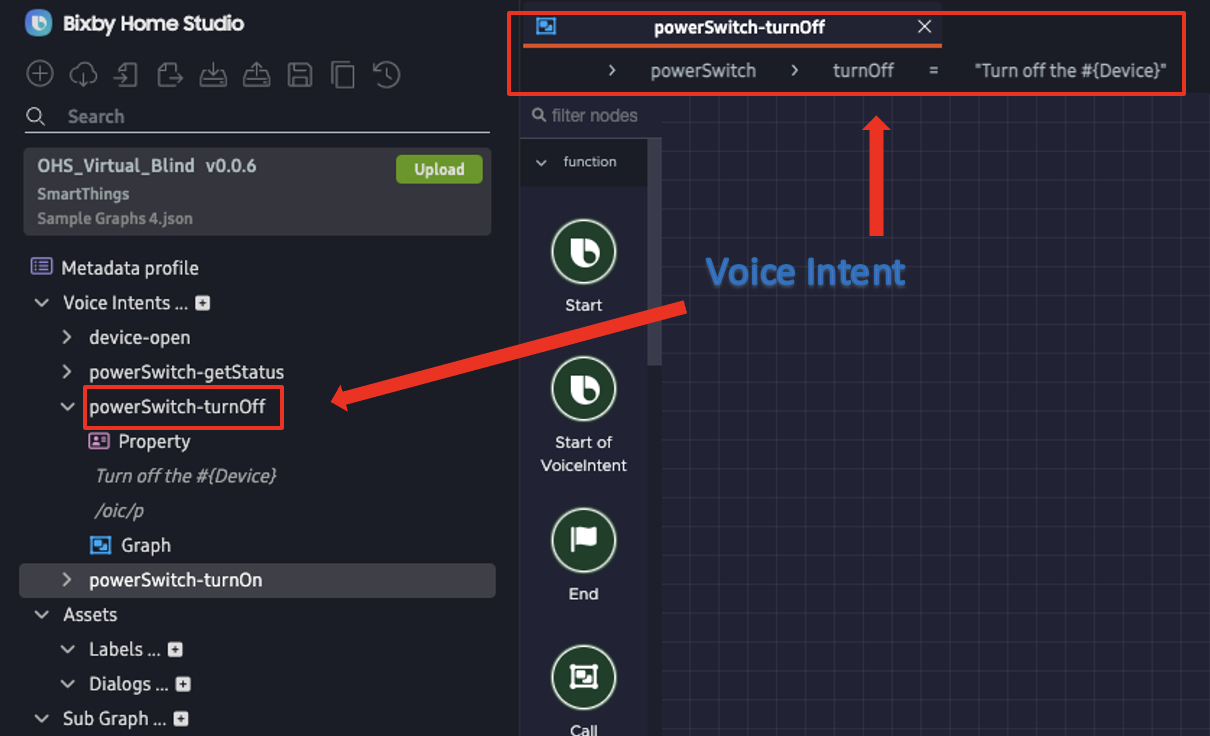
Voice Intents
Voice intents are a set of user's intentions that Bixby can understand from natural voice commands. Voice intents determine what voice commands (utterances) can be used to control a device.
For every voice intent, there's an option to either create a new action flow or provide the payload directly in JSON format. You can also import existing metadata for a device to use instead. Different capabilities support various voice intents. If you have an existing metadata graph, you can add additional voice intents.
If you want to create and use an action flow for a voice intent, navigate to the relevant Voice Intent menu in the left sidebar, and click Graph.
To learn more, visit the Voice Intents reference page.
Add More Voice Intents
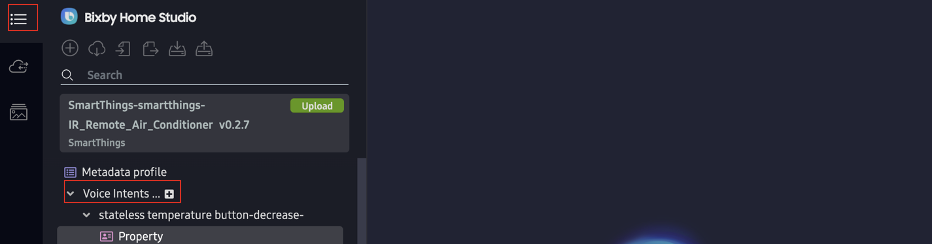
You can add additional voice intents from the main editor screen:
In the left sidebar, under Metadata profile, click the "+" symbol to the right of "Voice Intents." This opens the "Add Voice Intent" window.
If you can't see the left sidebar, click on the "BHP Metadata" icon in the top left corner of the menu bar to open it.
Select a Category from the drop-down.
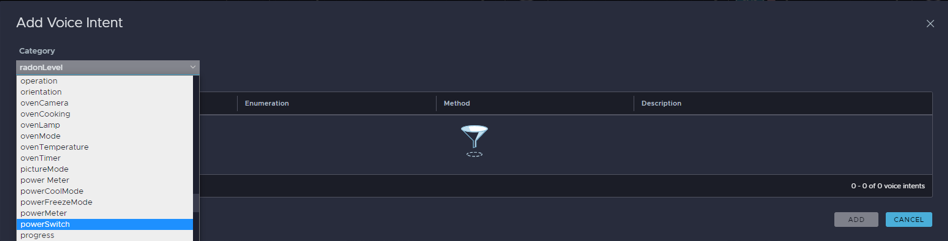
Select a voice intent from the list of potential voice actions and sample utterances for the chosen category.
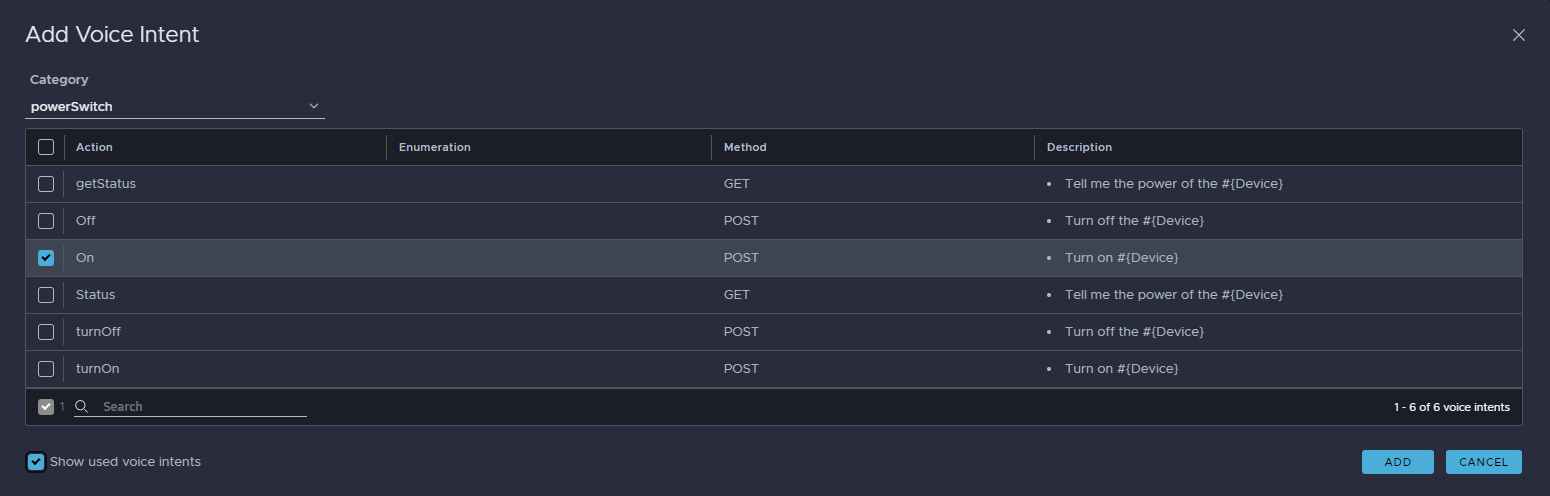
Click ADD. You can view the voice intent you added in the Voice Intents section.
Status Bar and Console
The bottom of the window shows your device information and your account email address. It also allows you to do the following:
- To view test device information, click on the device name.
- If the device is online, a green dot is visible next to the device's name. If it's offline, a red dot is visible next to the device's name.
- To view your BHP settings, click on your account name (your email address).
- To open and close the console window, click the left corner icon. This is the only way to get to the Log and Node Search tabs.
- To open the console window with the Problems tab open, click either of the warnings and errors icons. The number by each icon will show you the number of warnings and errors in your project.
- To open the console window with the Notifications tab open, click the notifications icon (the bell).

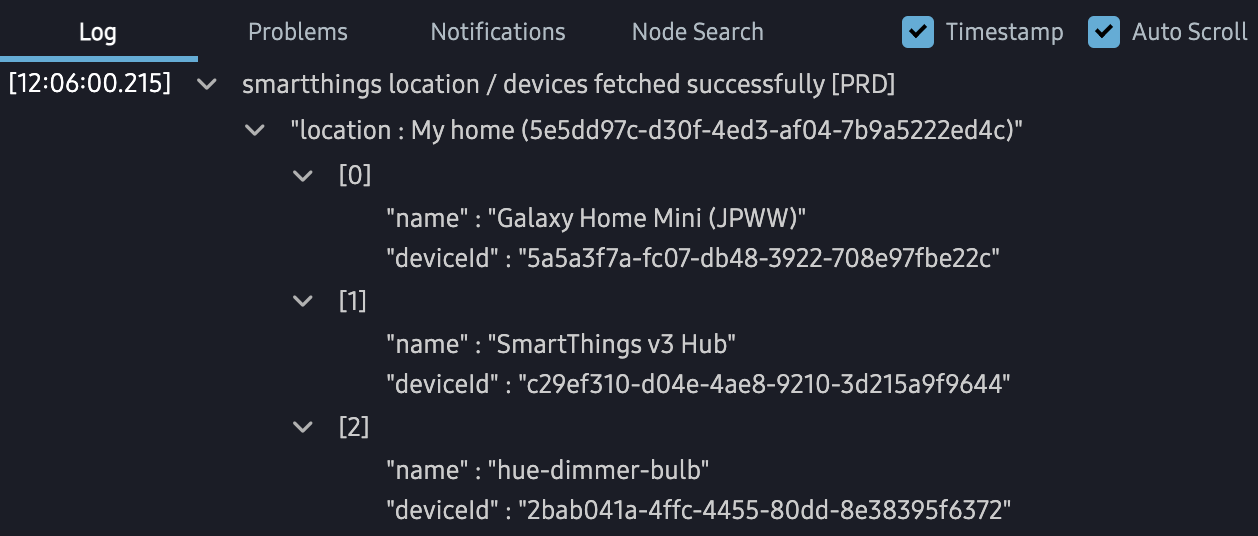
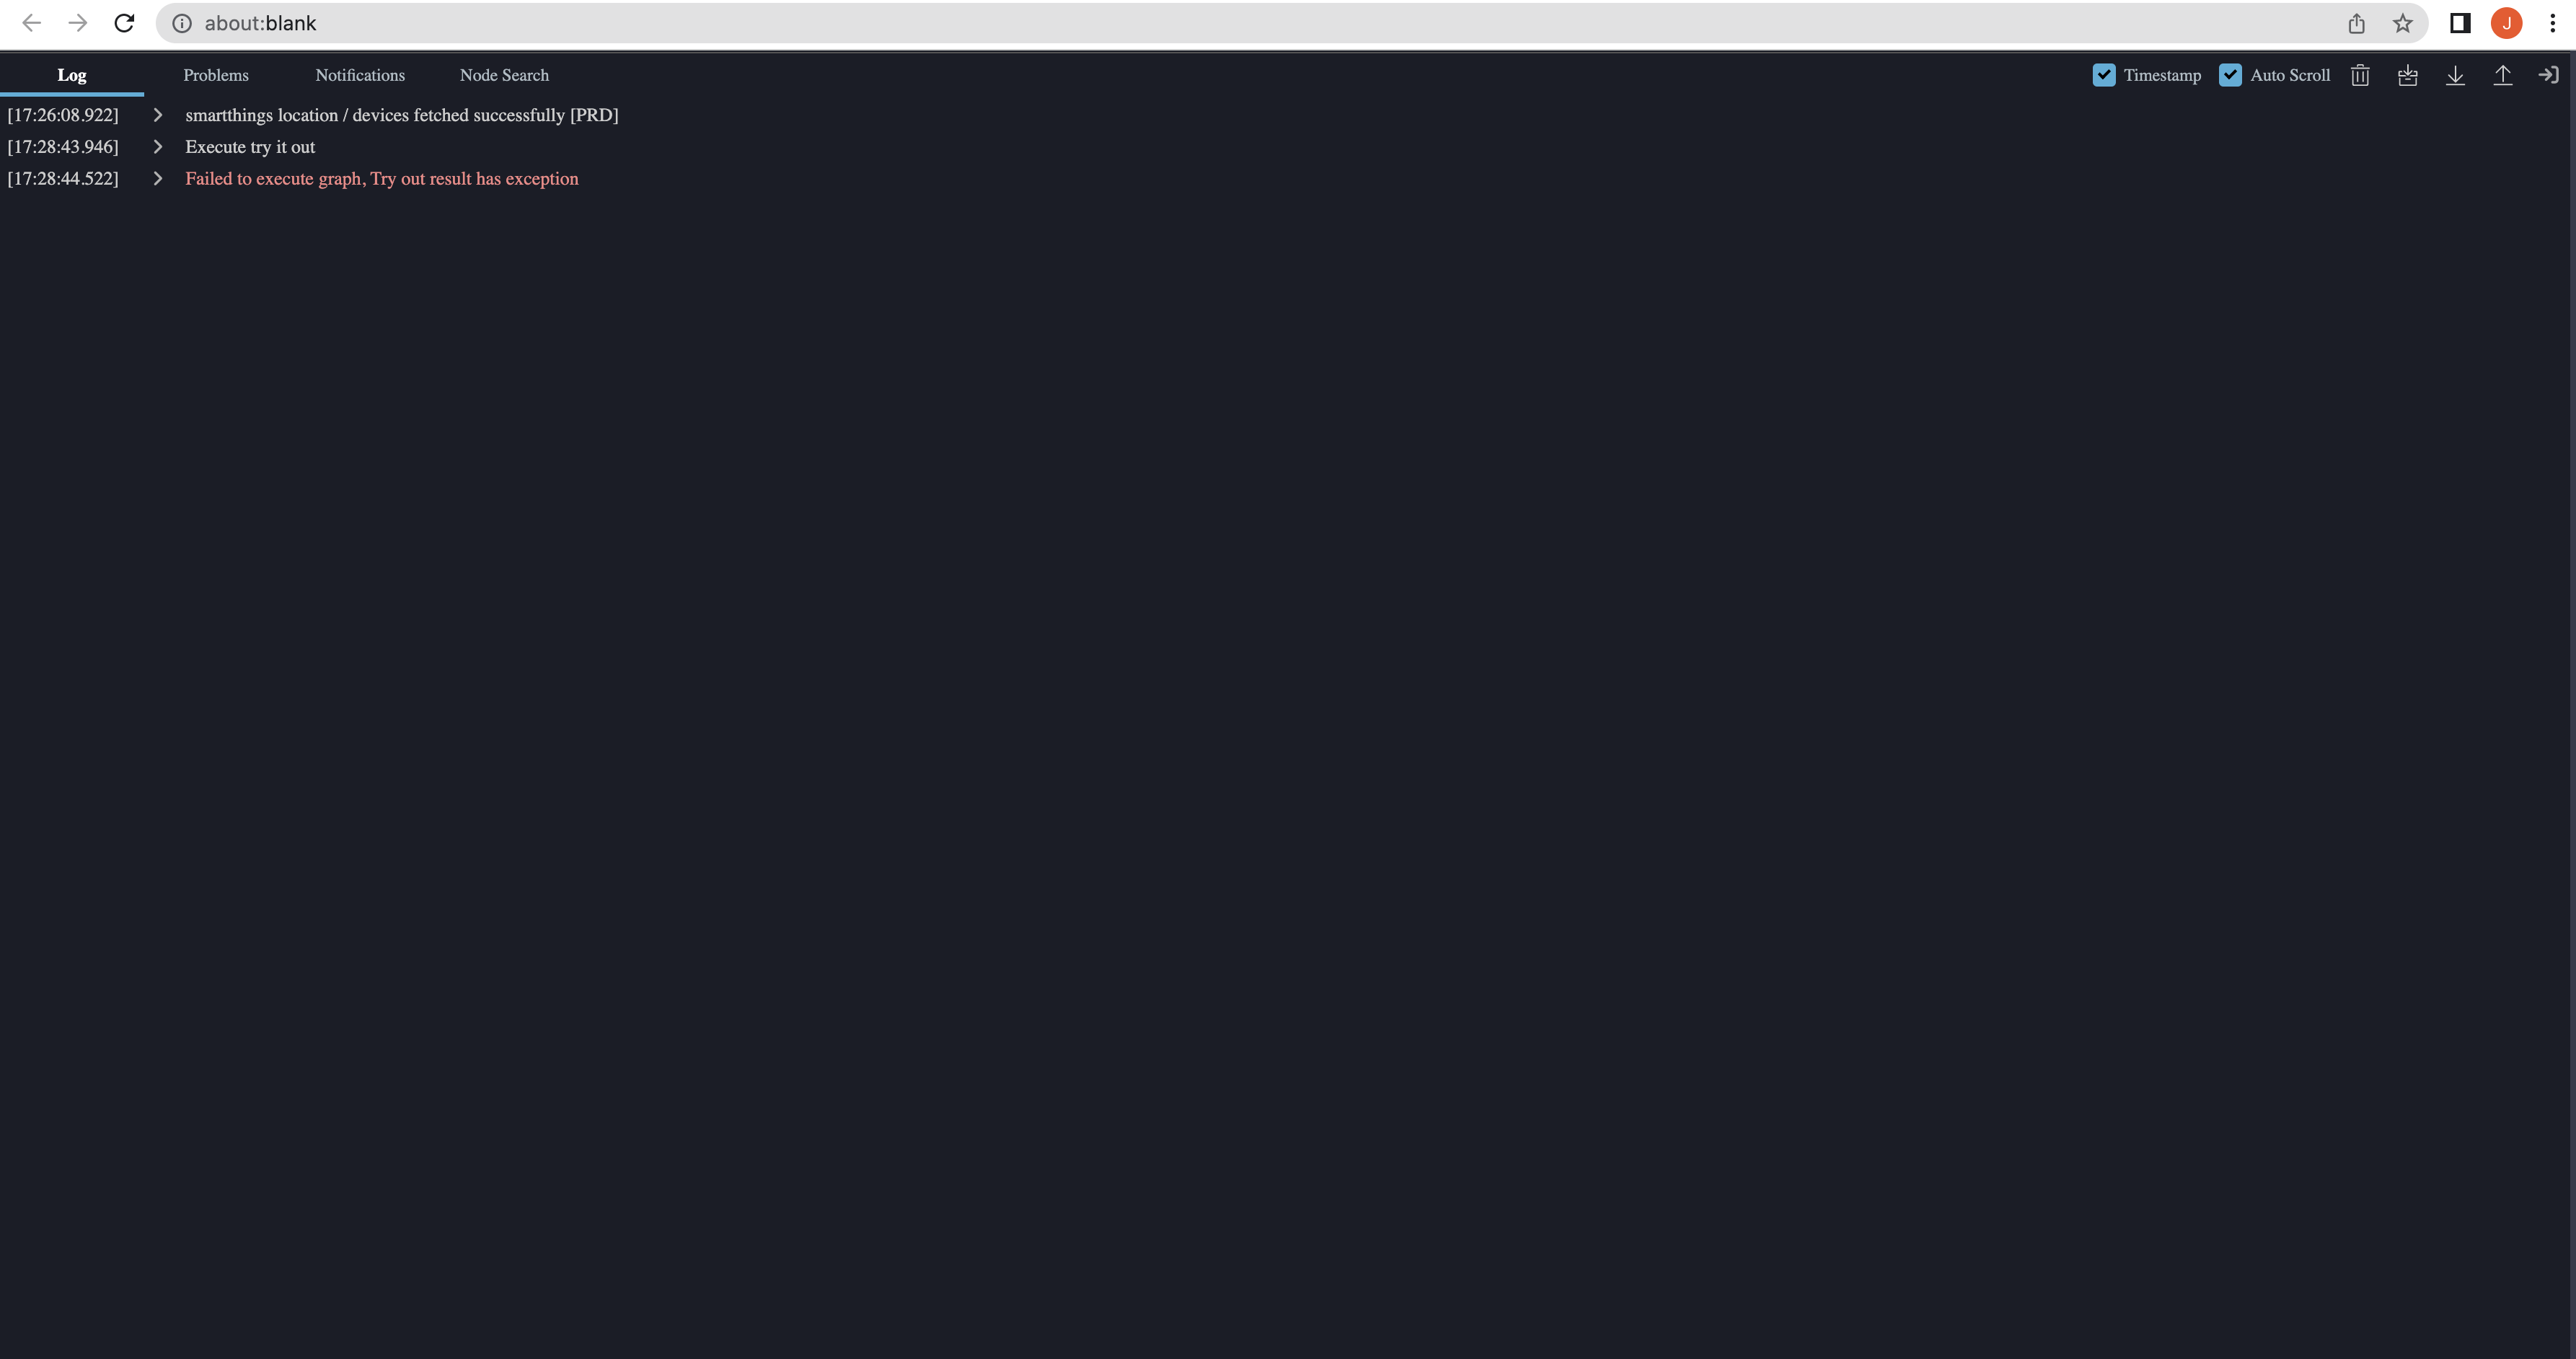
Log Tab
In the console, to view the log of activities that have taken place during your BHS session, click the Log tab.
You can choose to add time stamps and enable auto scrolling by checking the boxes for Timestamp and Auto Scroll, which are at the top right of the console window.
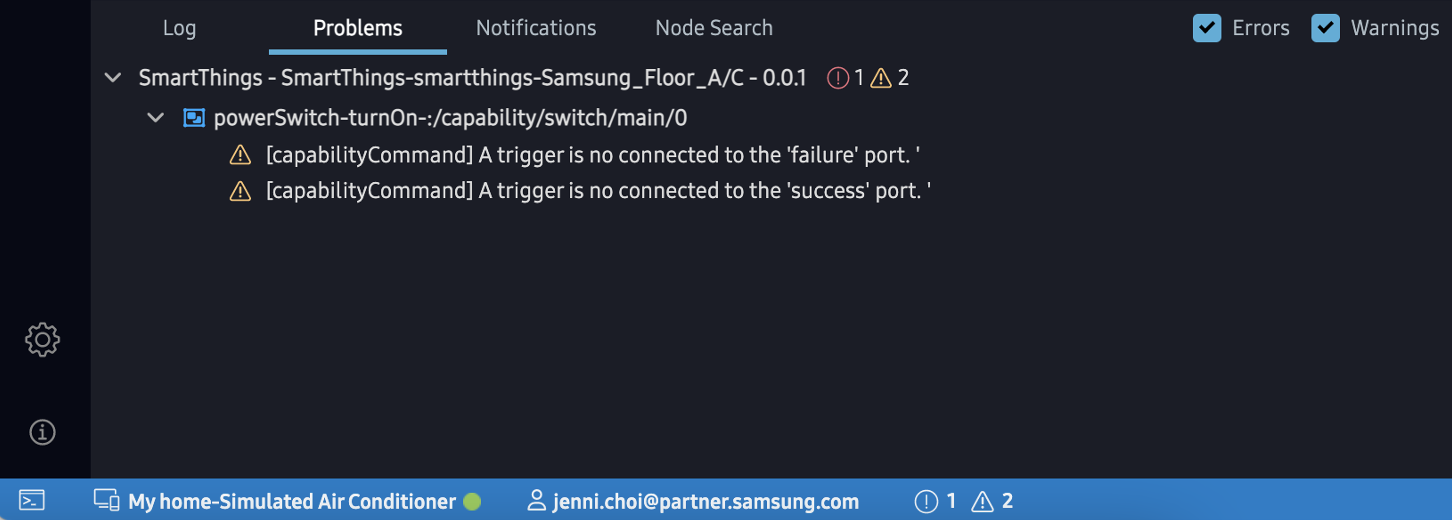
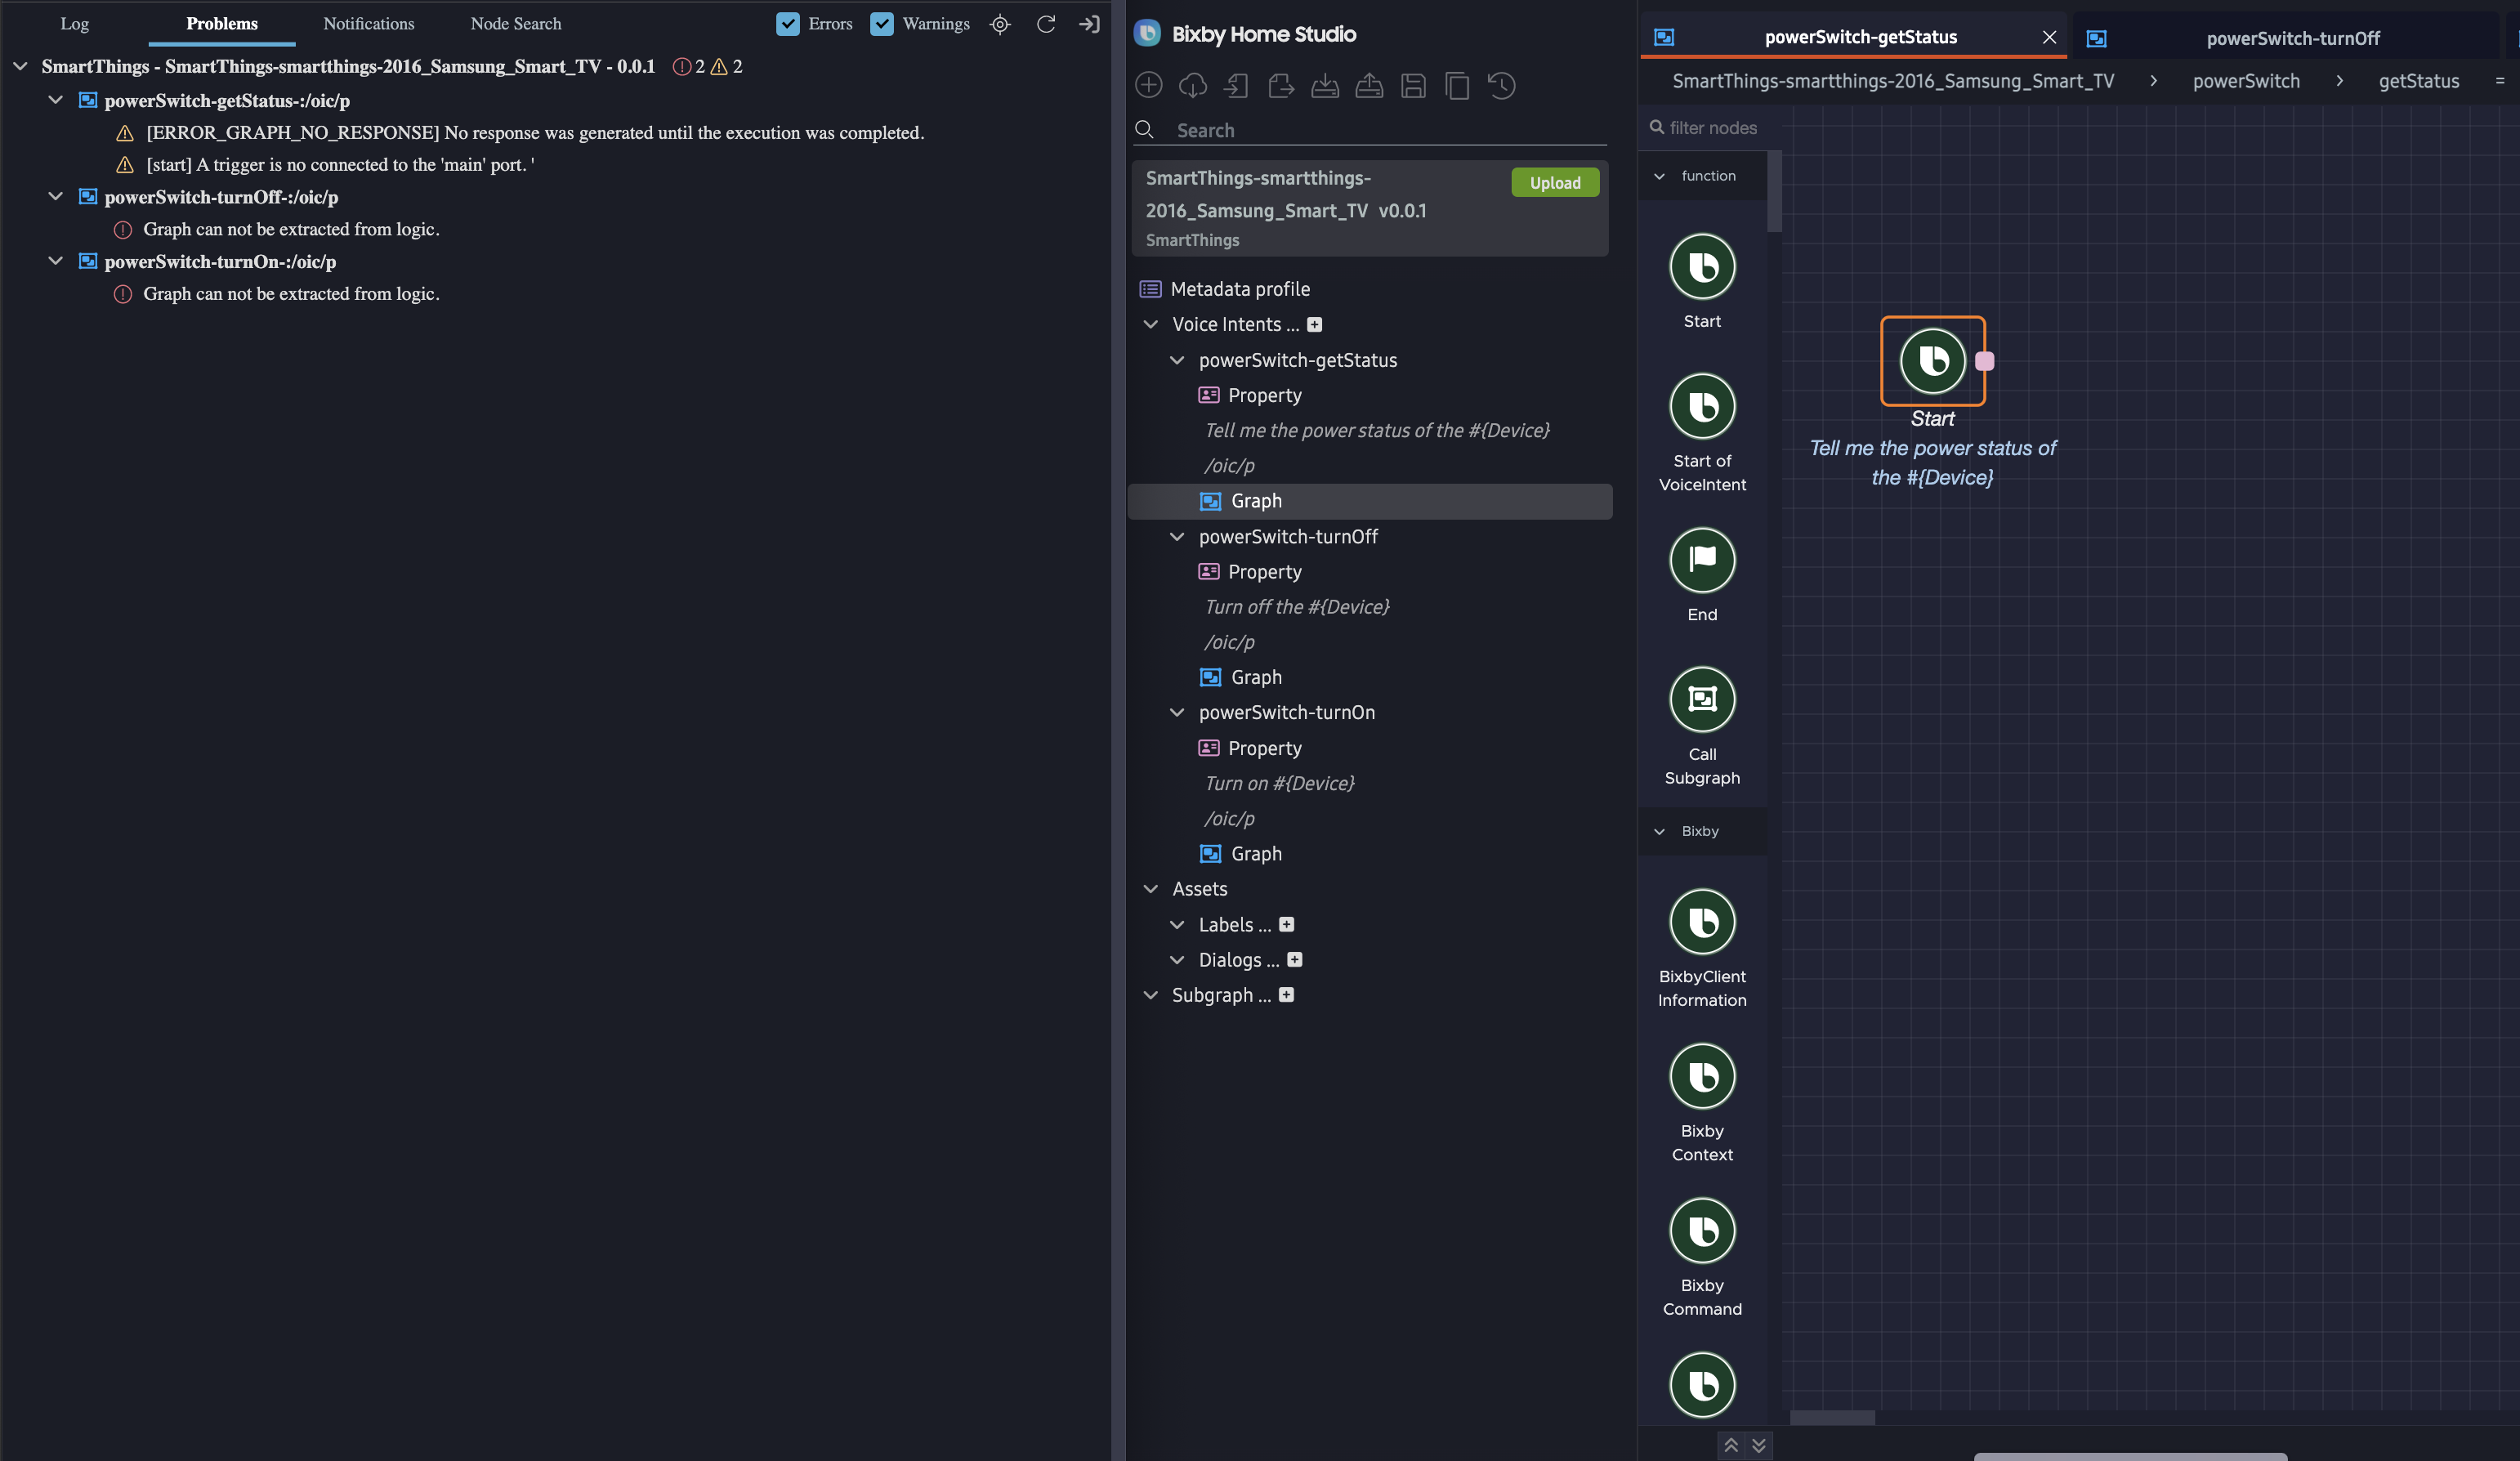
Problems Tab
To view the Problems tab in the console, click the icons for warnings and errors in the status bar along the bottom of the editing window. This opens a pane at the bottom that shows current issues with the project.
You can choose which kinds of messages to show by checking or unchecking the boxes for Warnings and Errors.
Notifications Tab
The Notifications tab will show you any push notifications that have been sent to you during on-device testing.
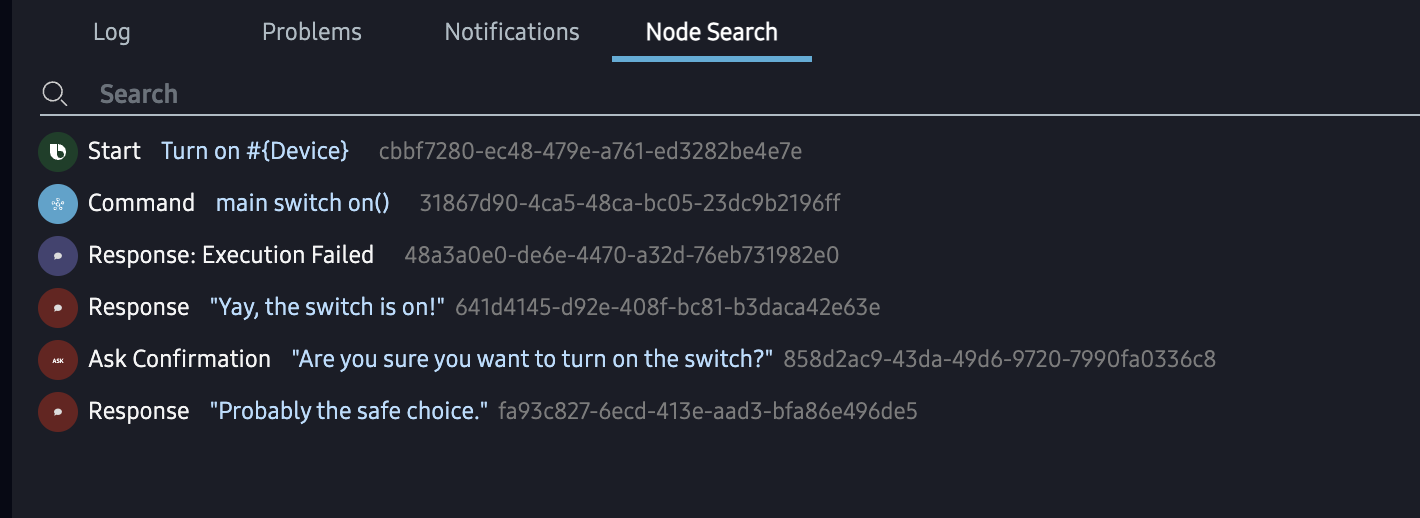
Node Search Tab
The Node Search tab helps you find specific nodes in the currently displayed graph. This can be useful to navigate around large graphs.
You can type in the search field to find nodes by type (such as Response or Ask Confirmation) as well as any description text associated with the node, such as response text or a command. Click on any node in the result list to highlight it in the graph.
Pop-out Console Window
You can also pop the console out of the main editor window into a separate window, which enables you to more easily read the console information while working on your metadata graphs.
To pop the console out, click the Pop out window icon  that is at the top right of the console window.
A new window opens, which contains the console information.
You can put the console window next to your main editor window to more easily access the console information while working on your metadata.
To pop the console window back into the main editor window, click the Pop in window icon  at the top right of the console window.
Display Submissions Statuses
To display the status of your submissions to BHS, click Submissions in the activity bar. You can also view the submission history and state transition details.
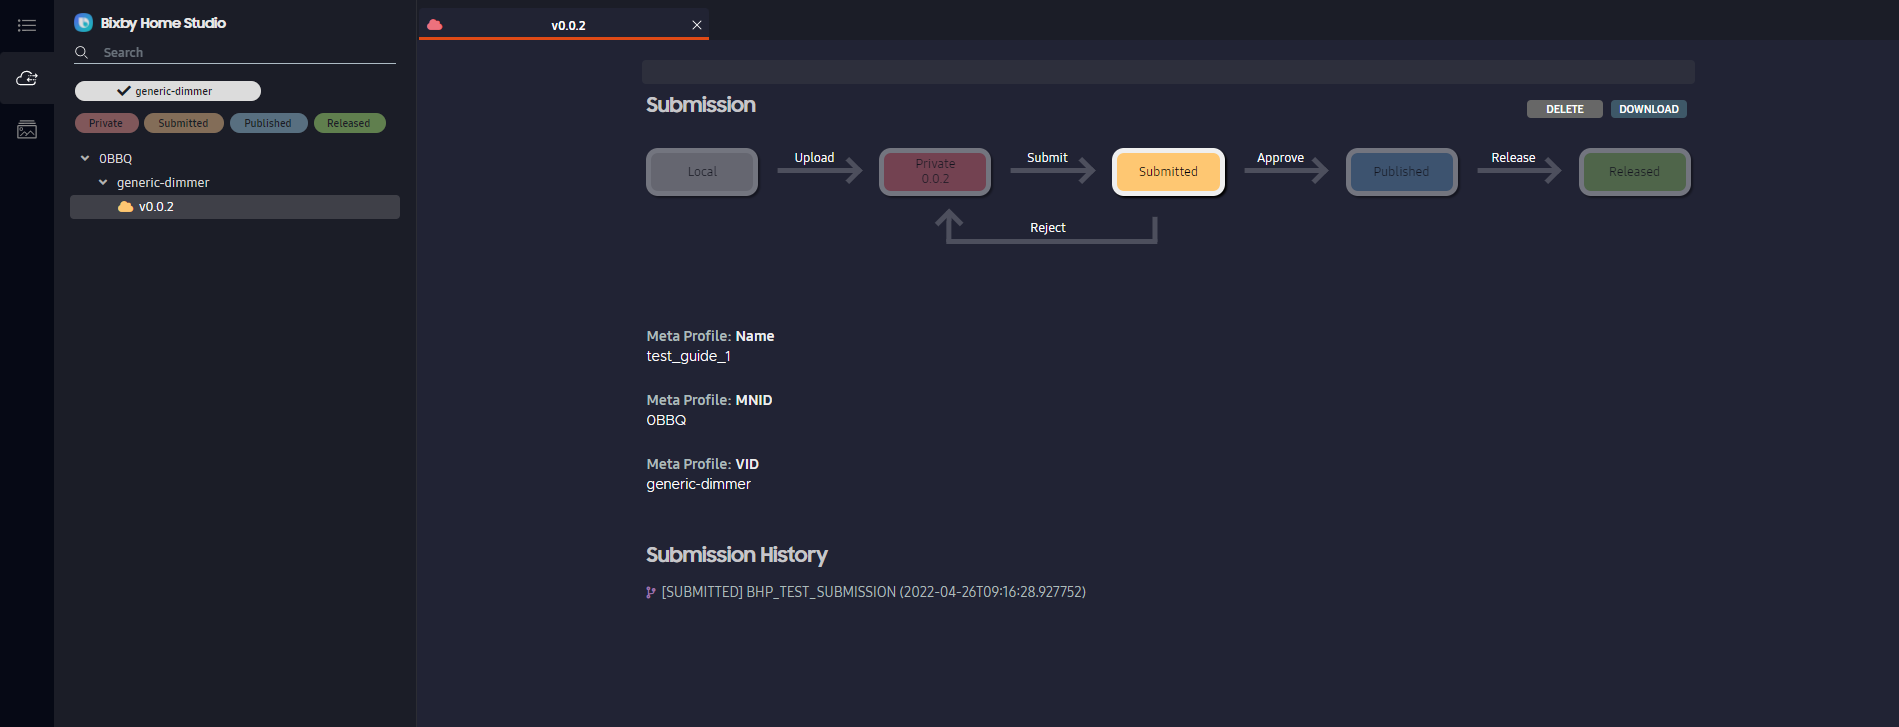
To learn more about submissions, read the Publishing The Bixby Device Graph (BHS Metadata Submission) guide.
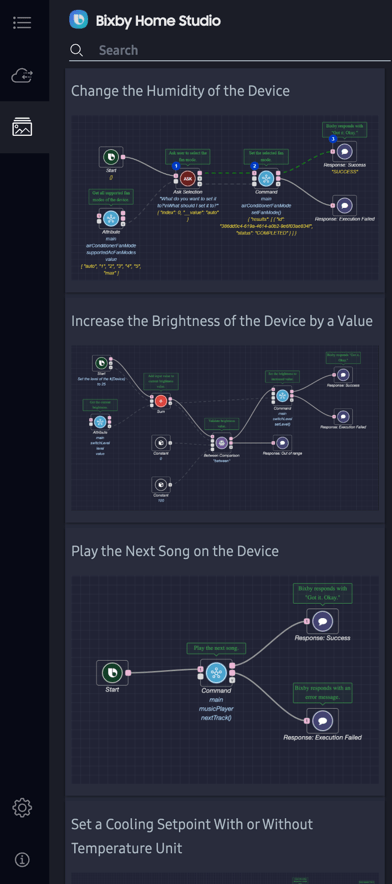
Sample Graphs
You can use sample action flow graphs to build your own graphs. To drag and drop a sample graph to the editor, first click Graph under your chosen voice intent in the metadata sidebar. Then, in the activity bar, click the Sample Graphs icon. When you find an appropriate graph, drag it to the editor.
Here are some additional resources on sample graphs:
Introduction to Sample Graphs: Describes sample graphs and how to use them.
Basic Sample Graphs: Highlights basic sample graphs.
Metadata Options
Aside from creating new metadata, you can also load, import, export, backup, restore, or save changes to metadata. This allows you to collaborate with other device developers on your action flows, as well as gives you backups for flows you are working on.
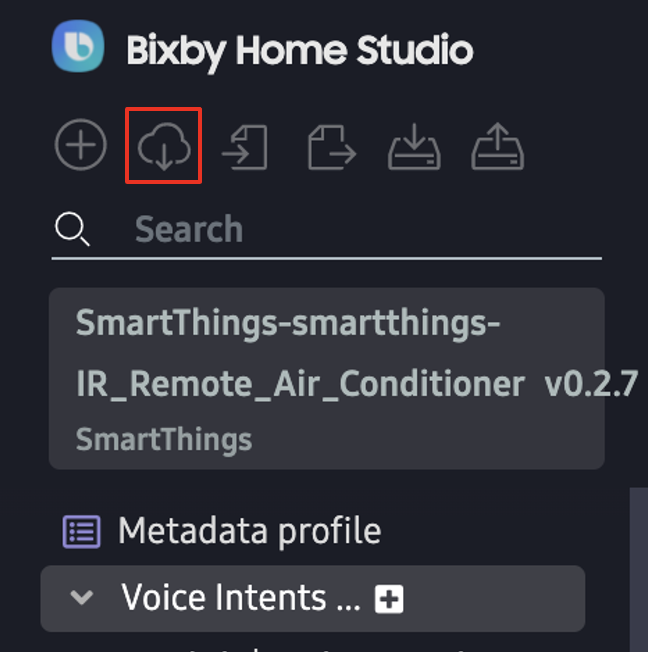
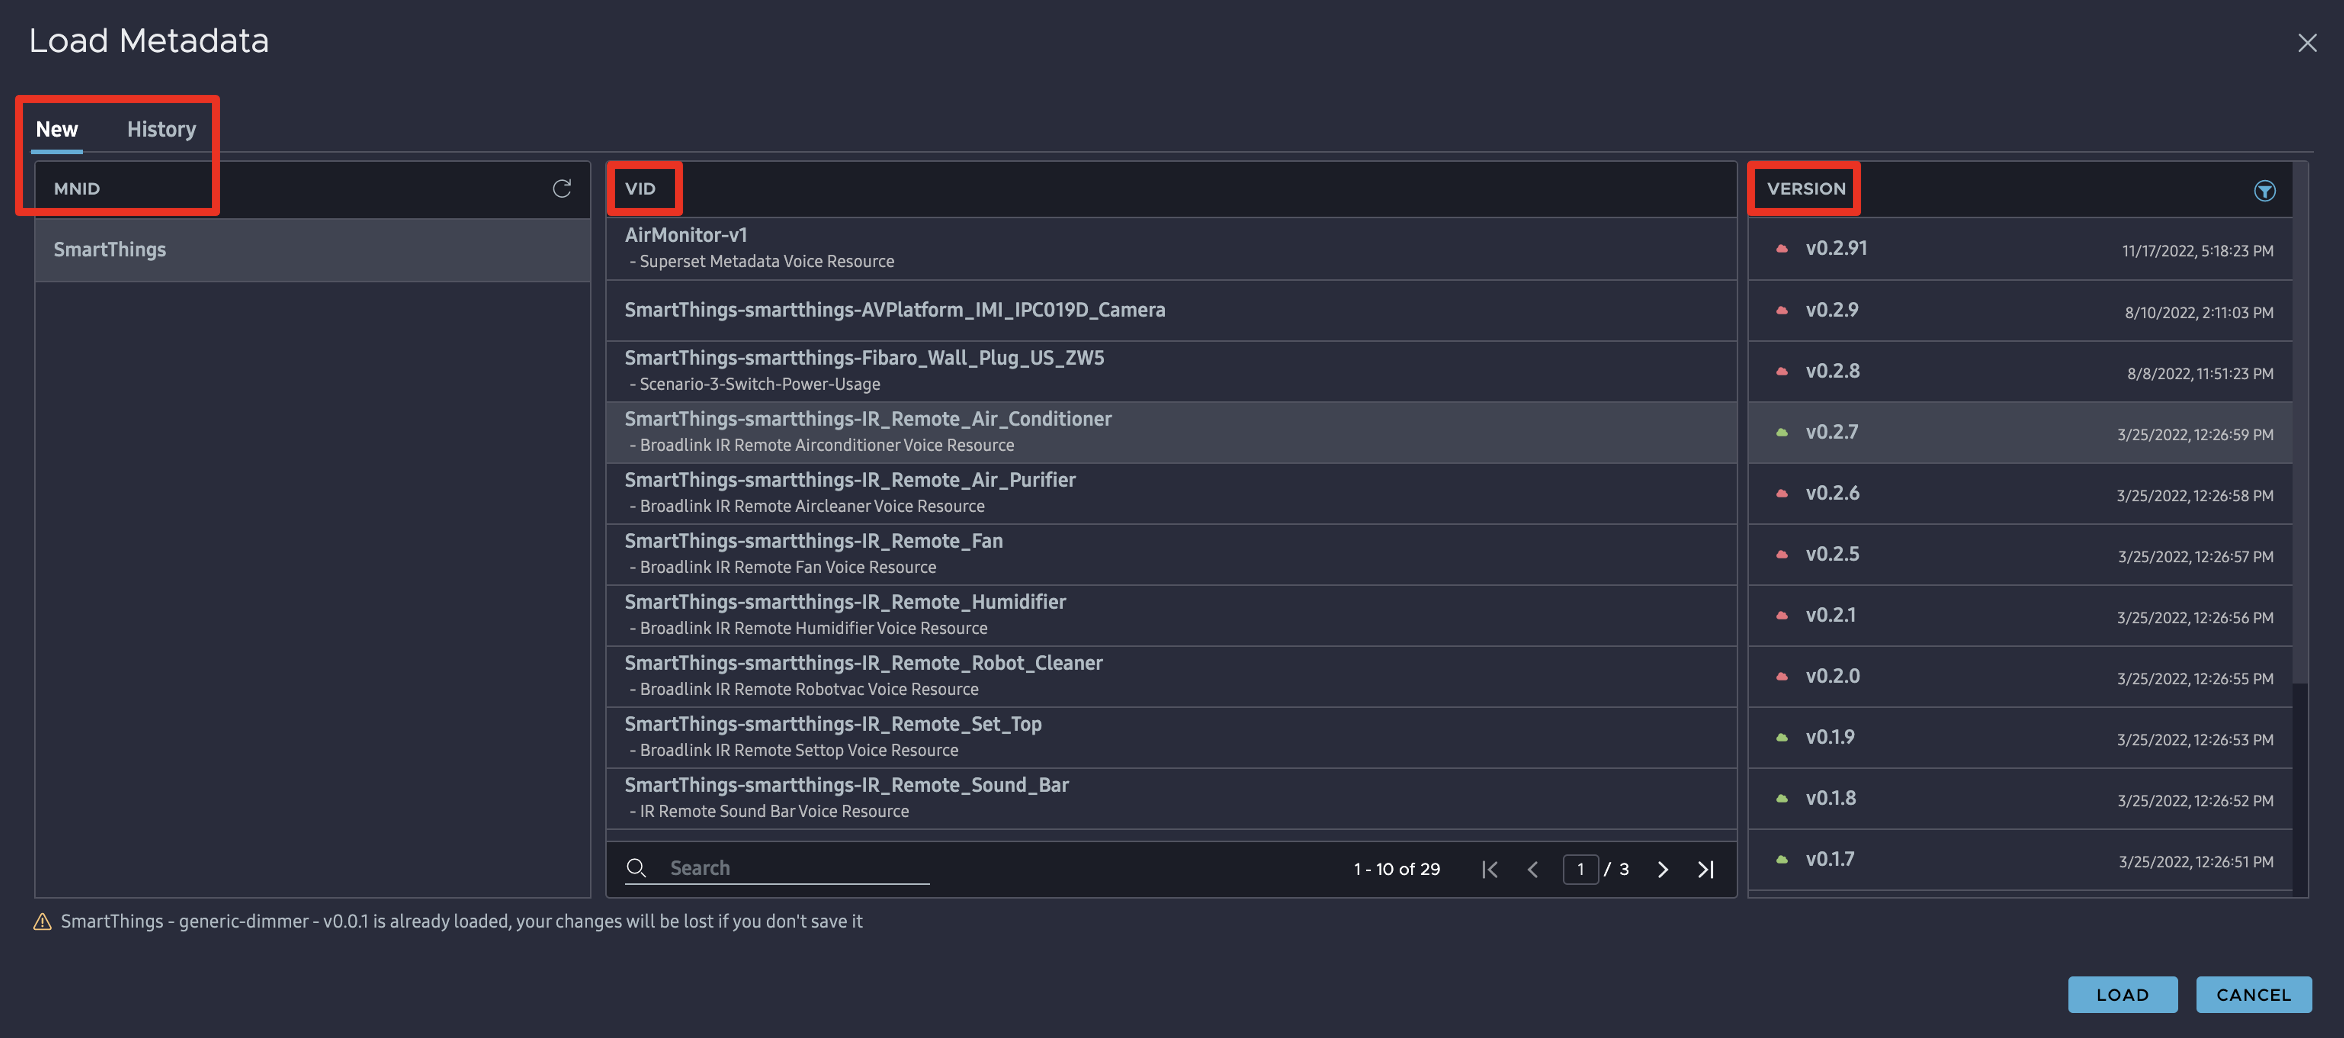
Load Metadata
You can update the existing metadata of the device, to add or edit voice actions for it. To do this, click the Load Metadata icon at the top of the metadata sidebar. Then, you can choose metadata to load, by clicking the New or History tabs in the Load Metadata pop-up. The metadata listed under the New tab consists of existing metadata for devices that you have never loaded. The metadata listed under the History tab consists of existing metadata for devices that you have loaded before. Under either tab, you can specify which file to load by selecting a listed MNID, VID, and version number.
Compare Metadata Changes
If you'd like to compare your current file to a previously submitted one (or if you'd like to compare two versions of files), you can use the compare metadata changes feature.
Show Visual Differences Between Graphs
You can compare the current version of the graph to the most recently deployed version by clicking the Show Diff button at the top right of the editor. The two versions will be compared and displayed similarly to the example below.
- Graph features that have been deleted in the current version, but did exist in the previous version, will be highlighted in red.
- Graph features that have been added in the current version, but did not exist in the previous version, will be highlighted in green.
- Graph features that have changed between the two versions will be highlighted in yellow.
When a node has been modified between the two versions (highlighted in yellow), click on the node to show the previous and current configuration values.
When the editor is displaying differences, the Show Diff button will change to Hide Diff. Click it again to return to the normal editing mode.
Import and Export Voice Metadata
If you want to collaborate and share your voice metadata, you can import and export the voice metadata in a .json file.
Import Metadata
You can load your voice metadata to the editor. To do this, click on the Import button in the menu bar on the top left of the screen.

Click SELECT to select the metadata .json file.
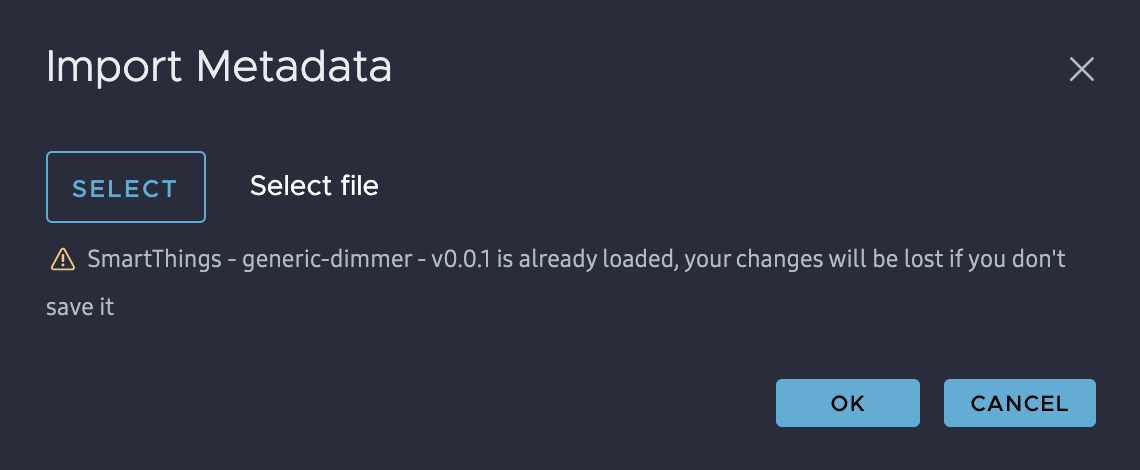
Click OK to load the metadata file.
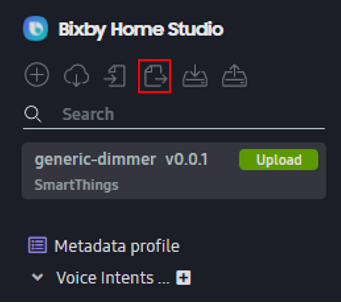
Export Metadata
You can upload created voice metadata to a server or share it with another developer using the Export feature. To do this, click on the Export button in the menu bar on the top left of the screen.
Enter the filename to save to:
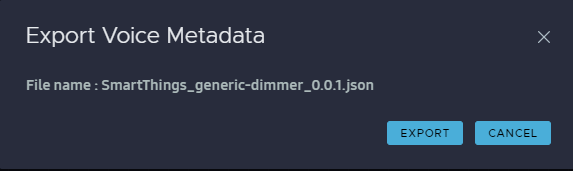
Click on the Export button and your Voice Metadata will be downloaded as a .json file.
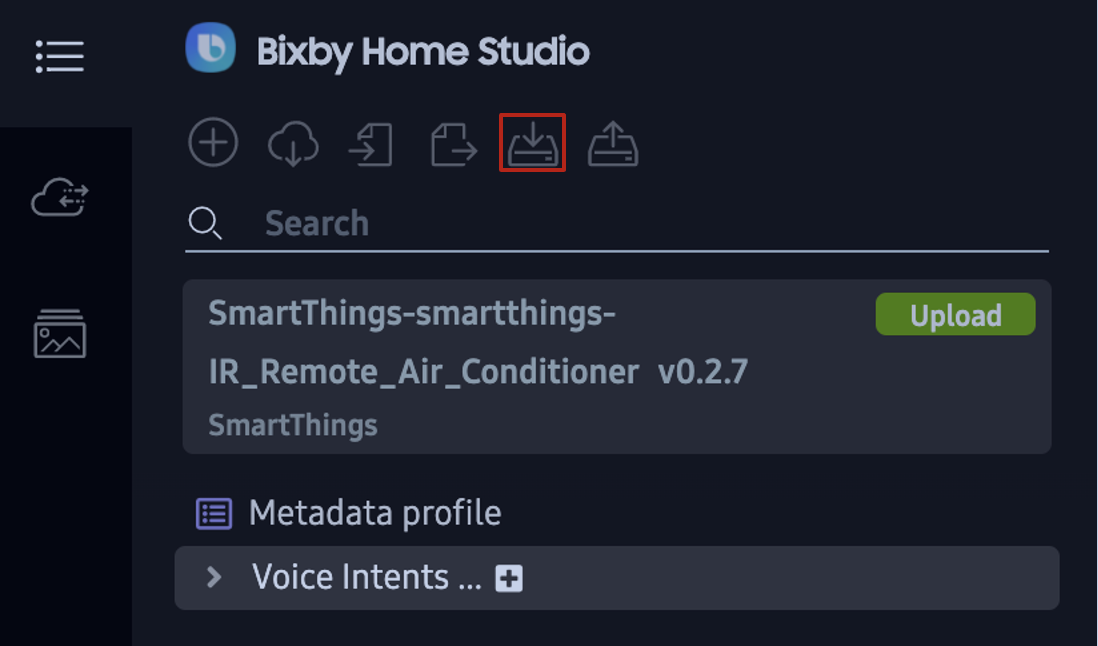
Back Up Metadata
To backup your metadata, click the Backup Metadata icon at the top of the metadata sidebar. As mentioned earlier, you can set the maximum number of backups by clicking the Settings icon at the bottom right of the activity bar.
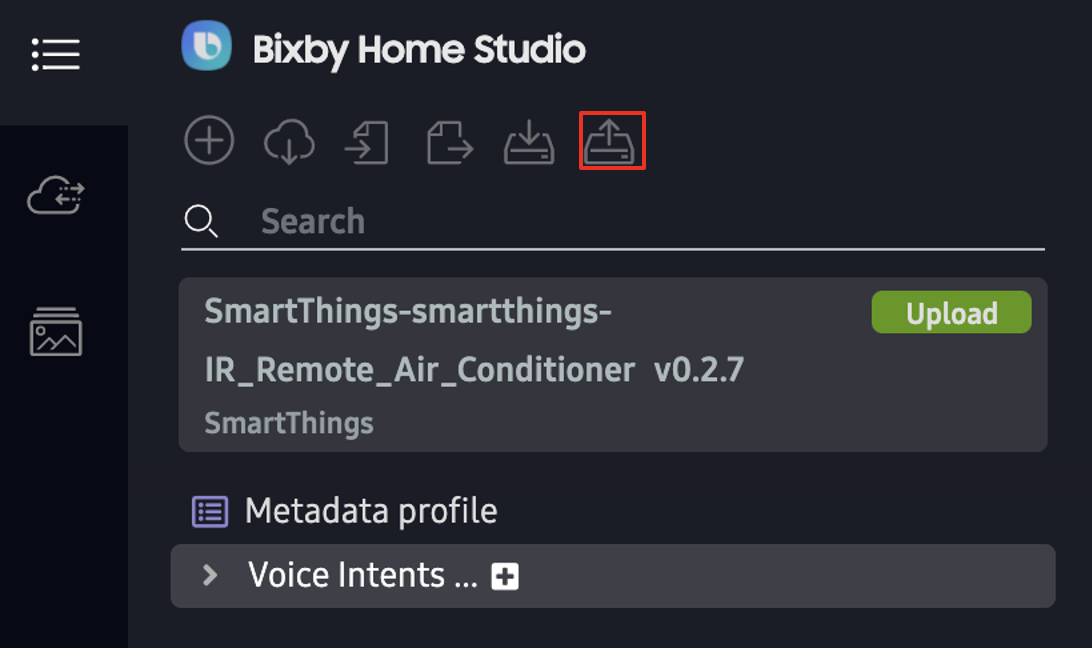
Restore Metadata
To restore the metadata that you last worked with, click the Restore Metadata icon at the top of the metadata sidebar.
Save Changes to a Local File
You can import a local file, make changes in BHS, and overwrite the existing file. Alternatively, you can save the changes in a duplicate file and choose its location. You can then load those recently saved files on your next BHS session.
First, import a local metadata file. Once you do this, the Save and Save as icons in the menu bar on the top left of the screen become fully visible and clickable.
![]()
The Save and Save as features are only supported in Chromium-based browsers, such as Chrome and Edge.
To overwrite the existing imported file using the Save function:
In BHS, make changes to the metadata.
Click the Save icon to overwrite the existing file. In this example, the name of the imported file is
SampleGraph1.json.
A pop-up appears and asks if you would like to save changes to
SampleGraph1.json.Click Save changes.After you click Save changes, a pop-up appears in the middle of the screen that says "Metadata saved to SampleGraph1.json".
To save a duplicate of the updated imported file using the Save as function:
- In BHS, make changes to the metadata.
- Click the Save as icon.
- Enter a file name and choose a location in which to save it. In this example, the file is saved as
example-file.jsonin the JSON files location.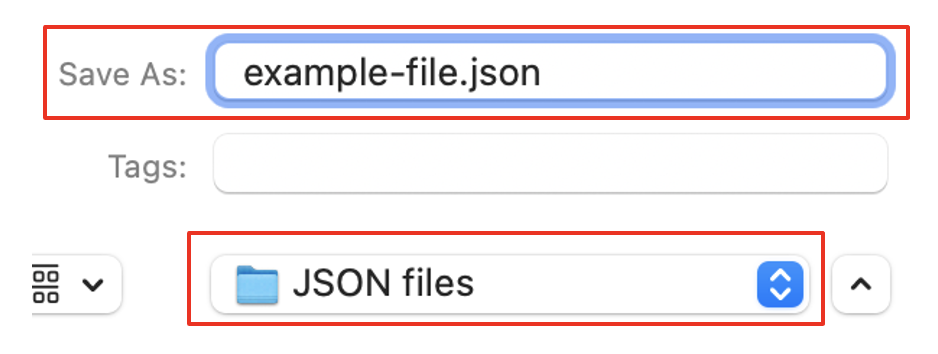 After you save the duplicated file, a pop-up appears in the middle of the screen that says "Metadata saved to example-file.json".
Load Recently-Saved File
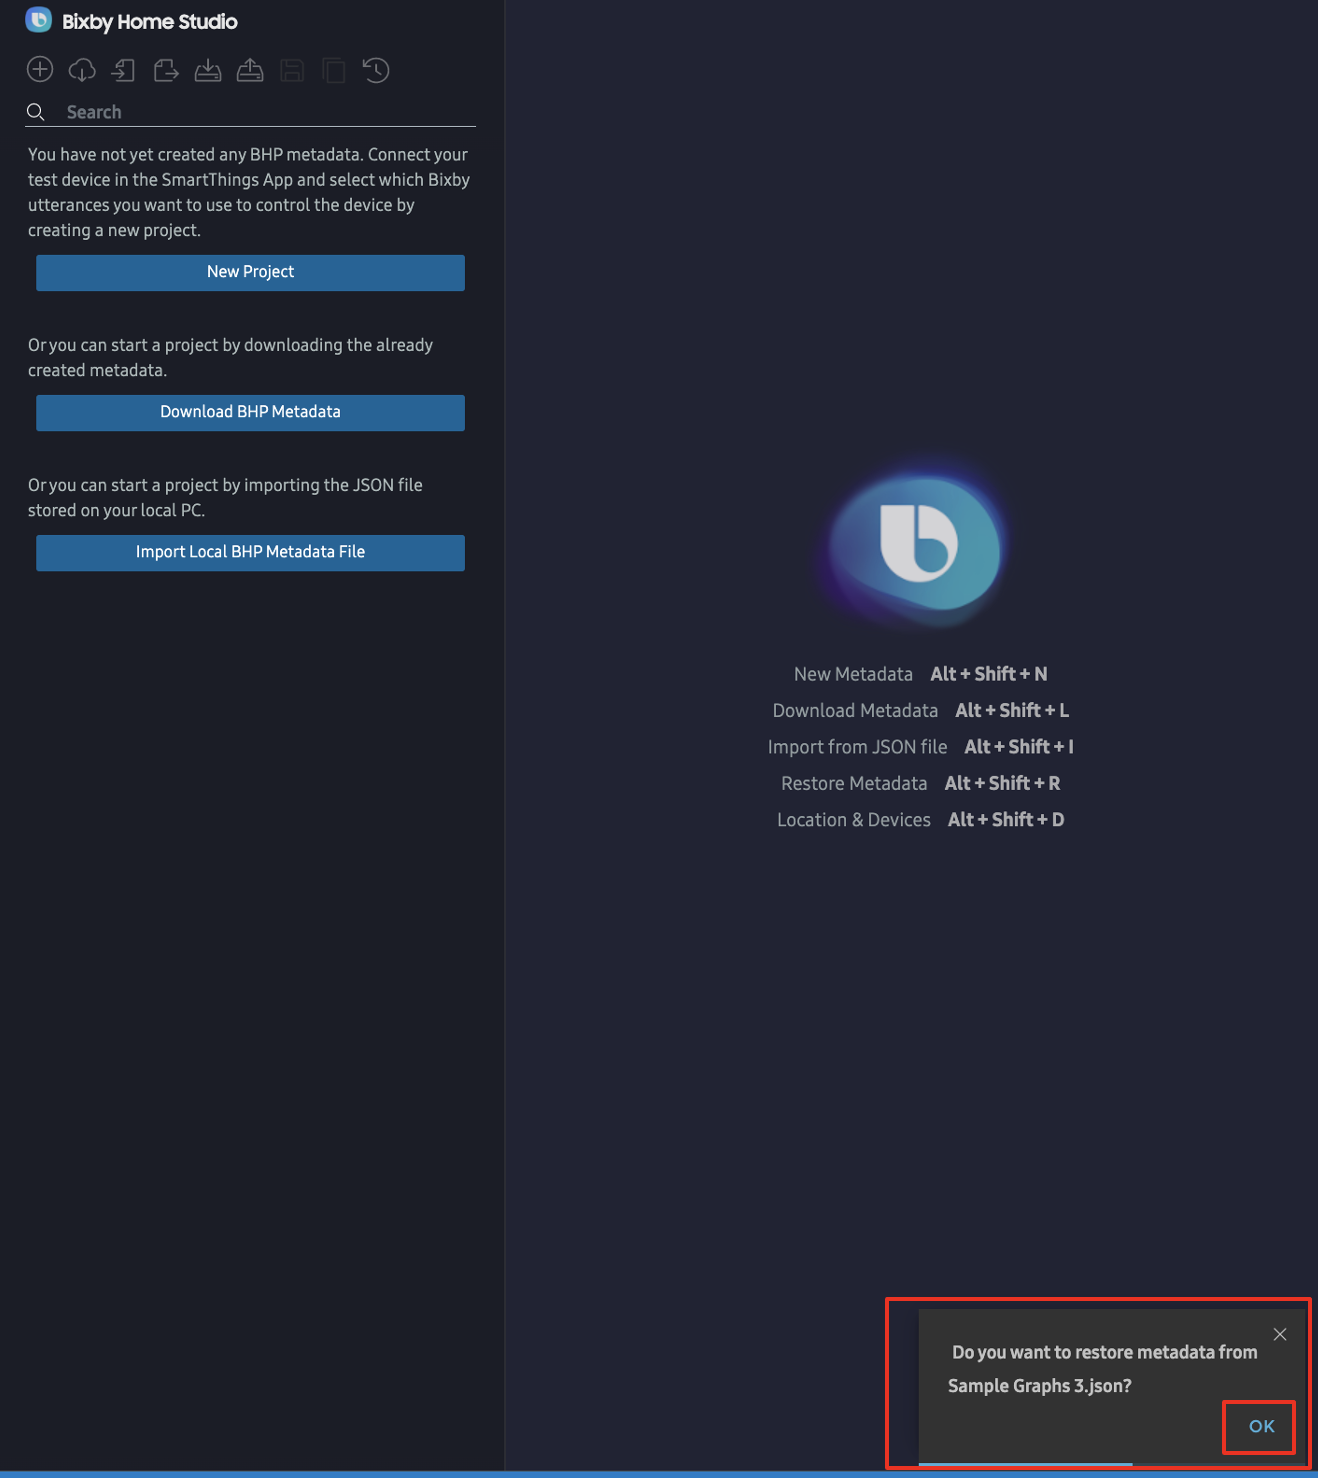
If you use the Save or Save as function for a metadata file before signing out of BHS, then upon signing into BHS again, a pop-up asks you if you want to restore metadata from the file you most-recently saved.
To restore metadata from this file:
Click OK.
 After you click OK, a pop-up asks if you want to let BHS edit the file.
Click Edit file.
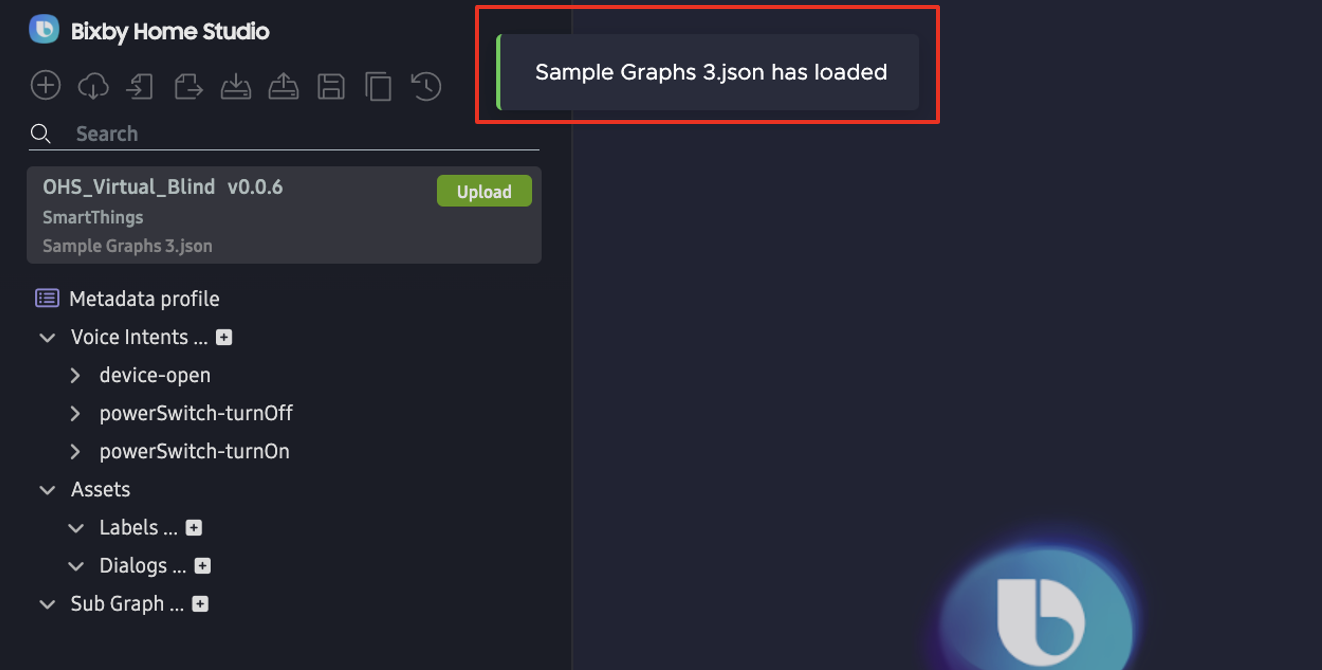
BHS restores the metadata and a pop-up message confirms that your file has been loaded.
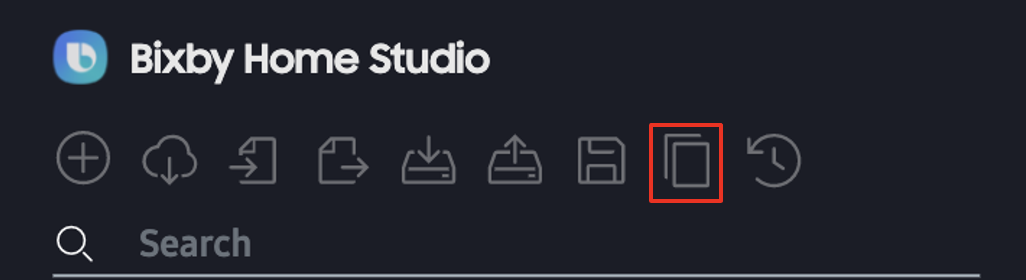
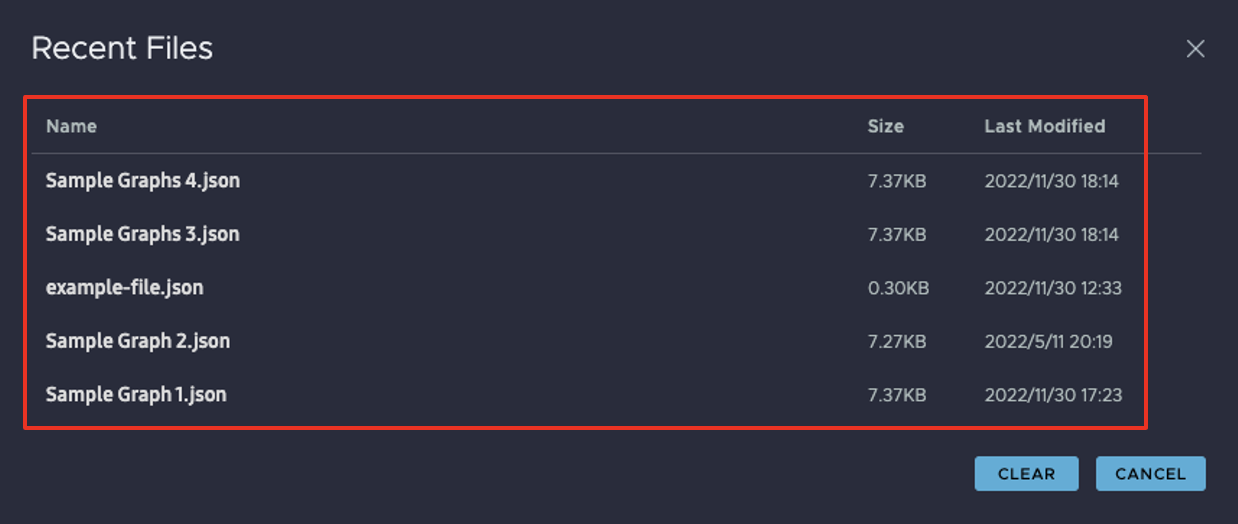
List Recent Files
To list up to five of your most-recently-saved files, click the Recent files icon at the top of the metadata sidebar.
![]()
You will see a pop-up with a list of up to five of your most recently-saved files.
About Icon
To view the BHS version, click the About icon at the bottom of the activity bar.
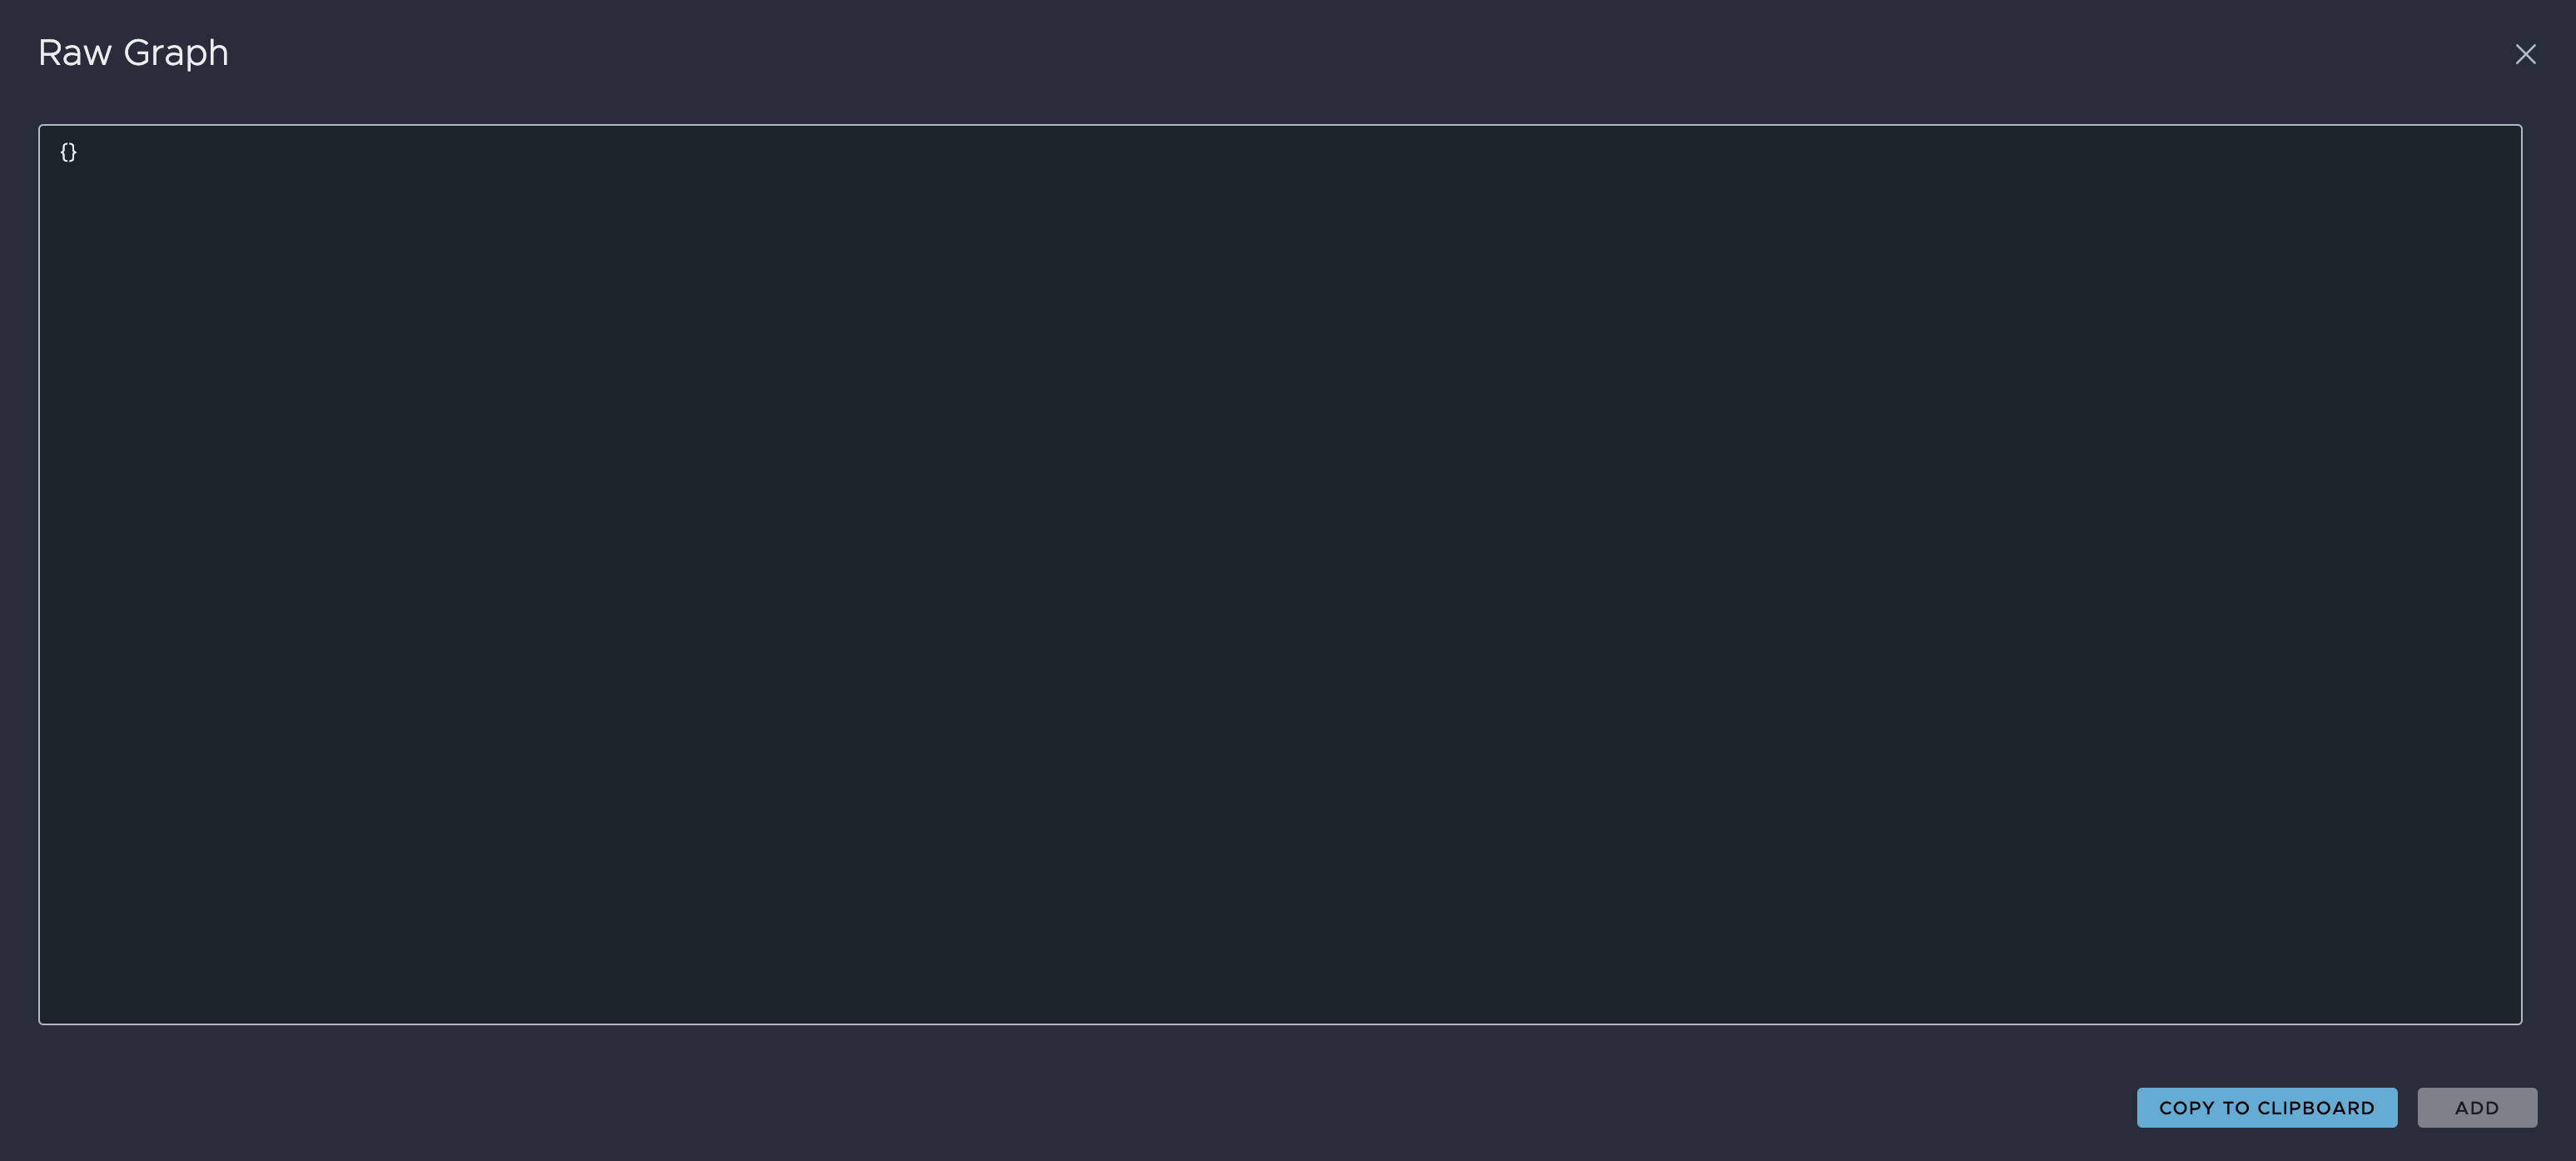
Raw Button
To display the graph's payload directly in JSON format, click the Raw button at the top right of the editor.
A window opens with the graph's raw JSON data. You can add new data or copy the existing data to the clipboard.
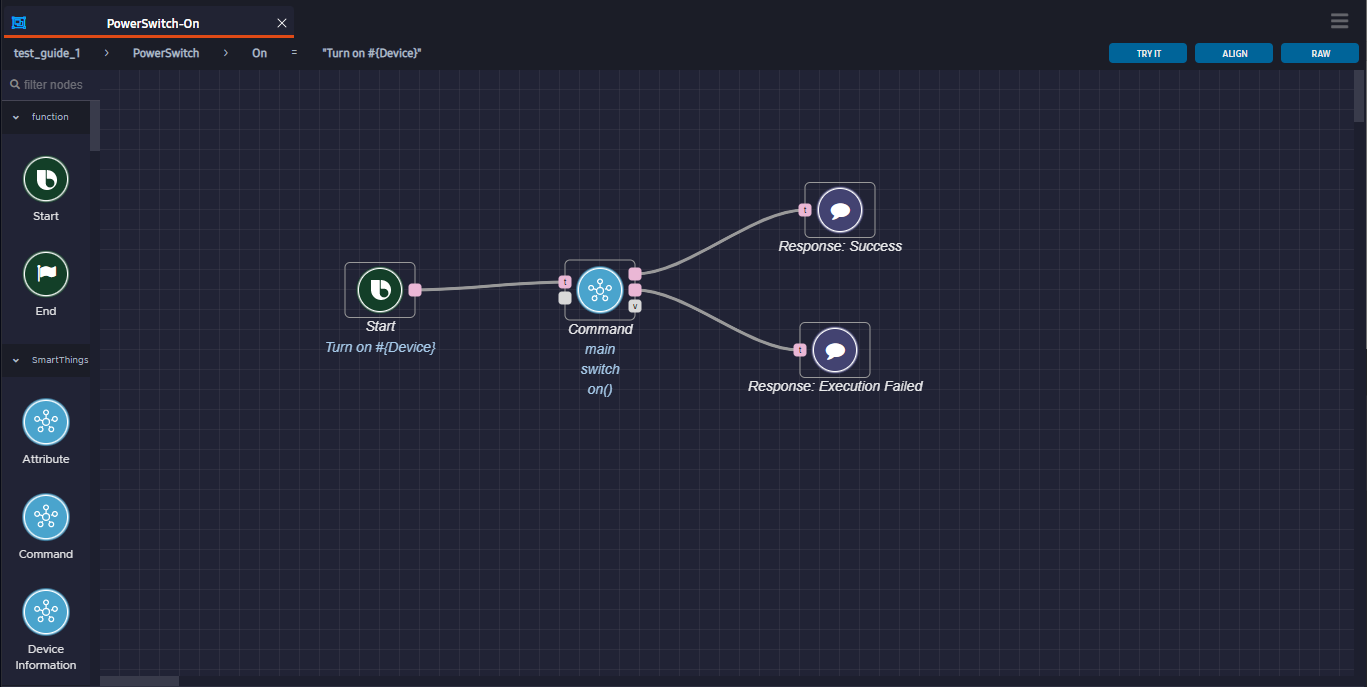
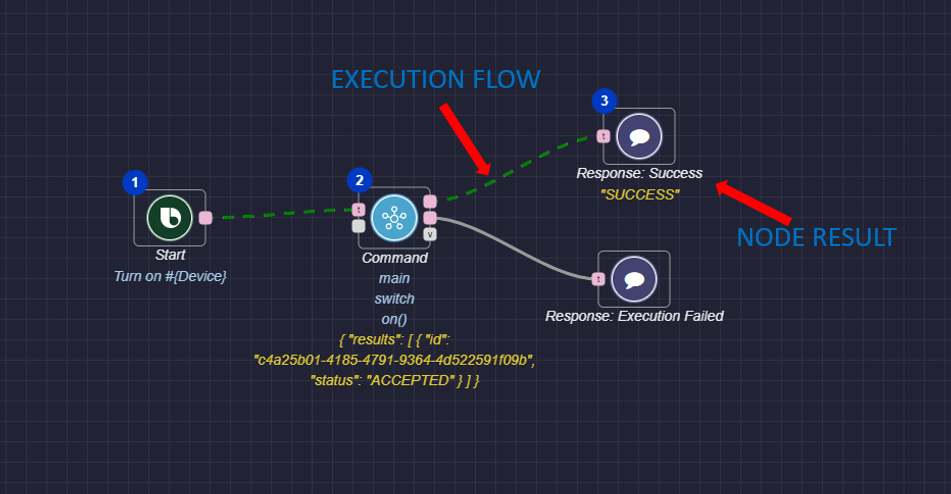
Test Action Flows
You can use the Try it out feature of the editor to test if the action flow works as intended on a real device. To test, click the Try It button at the top right of the editor.

You can see the flowing dashed line over the execution path. Any obtained values or responses are shown below the corresponding nodes.
Test Virtual Devices
If you don't have an actual device to test on, you can create a virtual device. Read Testing Virtual Devices in the On-Device Testing Guide for more information.